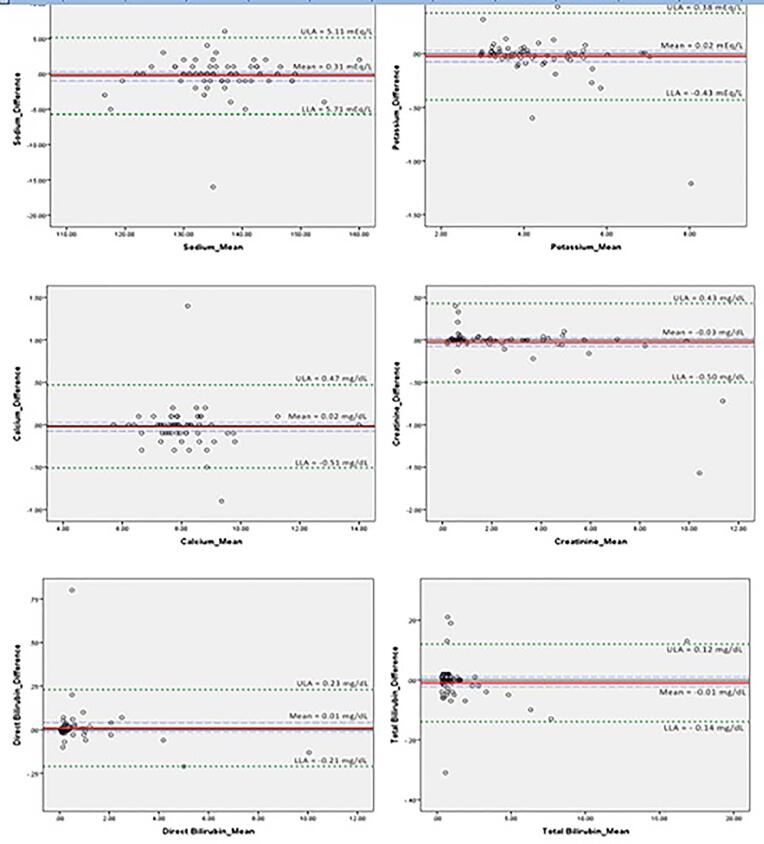
Fig. 1.
Bland–Altman plots for serum parameters with difference between 3 mL and 5 mL discarded samples plotted against the mean of the values. Green dotted lines, upper limit of agreement (ULA), and lower limit of agreement ( LLA ) refer to the limits corresponding to the two standard deviations ( SD ) from mean difference; blue dashed lines refer to the upper and lower limits of the confidence interval ( CI ) of the mean difference; the red solid line refers to the mean bias; and the black solid line refers to the line of equity.

