
Figure 7.
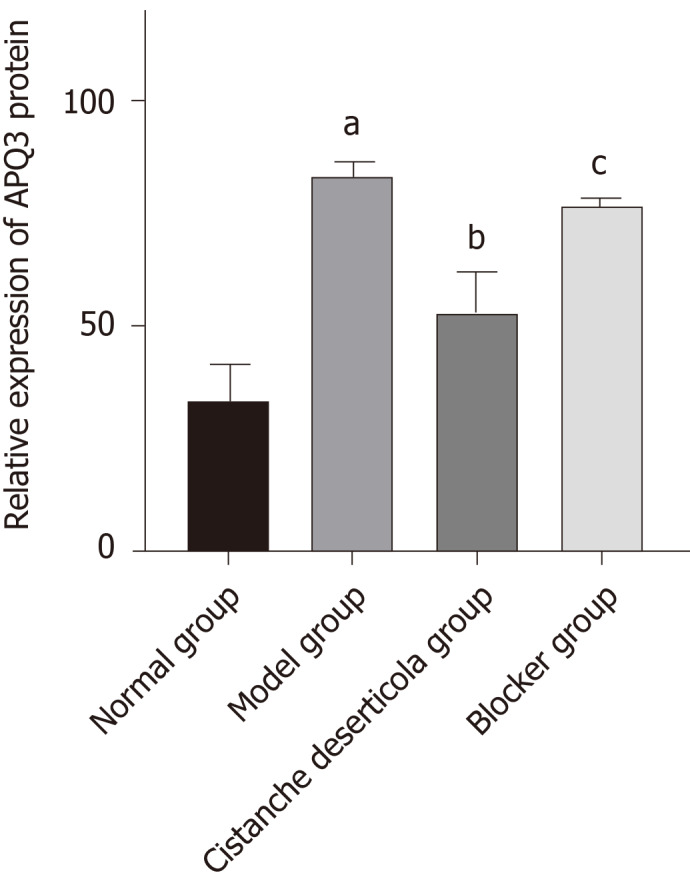
Relative expression of aquaporin 3 protein. aP < 0.05, compared with normal group; bP < 0.05, compared with model group; cP > 0.05, compared with model group. AQP3: Aquaporin 3.
Official websites use .gov
A
.gov website belongs to an official
government organization in the United States.
Secure .gov websites use HTTPS
A lock (
) or https:// means you've safely
connected to the .gov website. Share sensitive
information only on official, secure websites.
Relative expression of aquaporin 3 protein. aP < 0.05, compared with normal group; bP < 0.05, compared with model group; cP > 0.05, compared with model group. AQP3: Aquaporin 3.