Fig. 30.

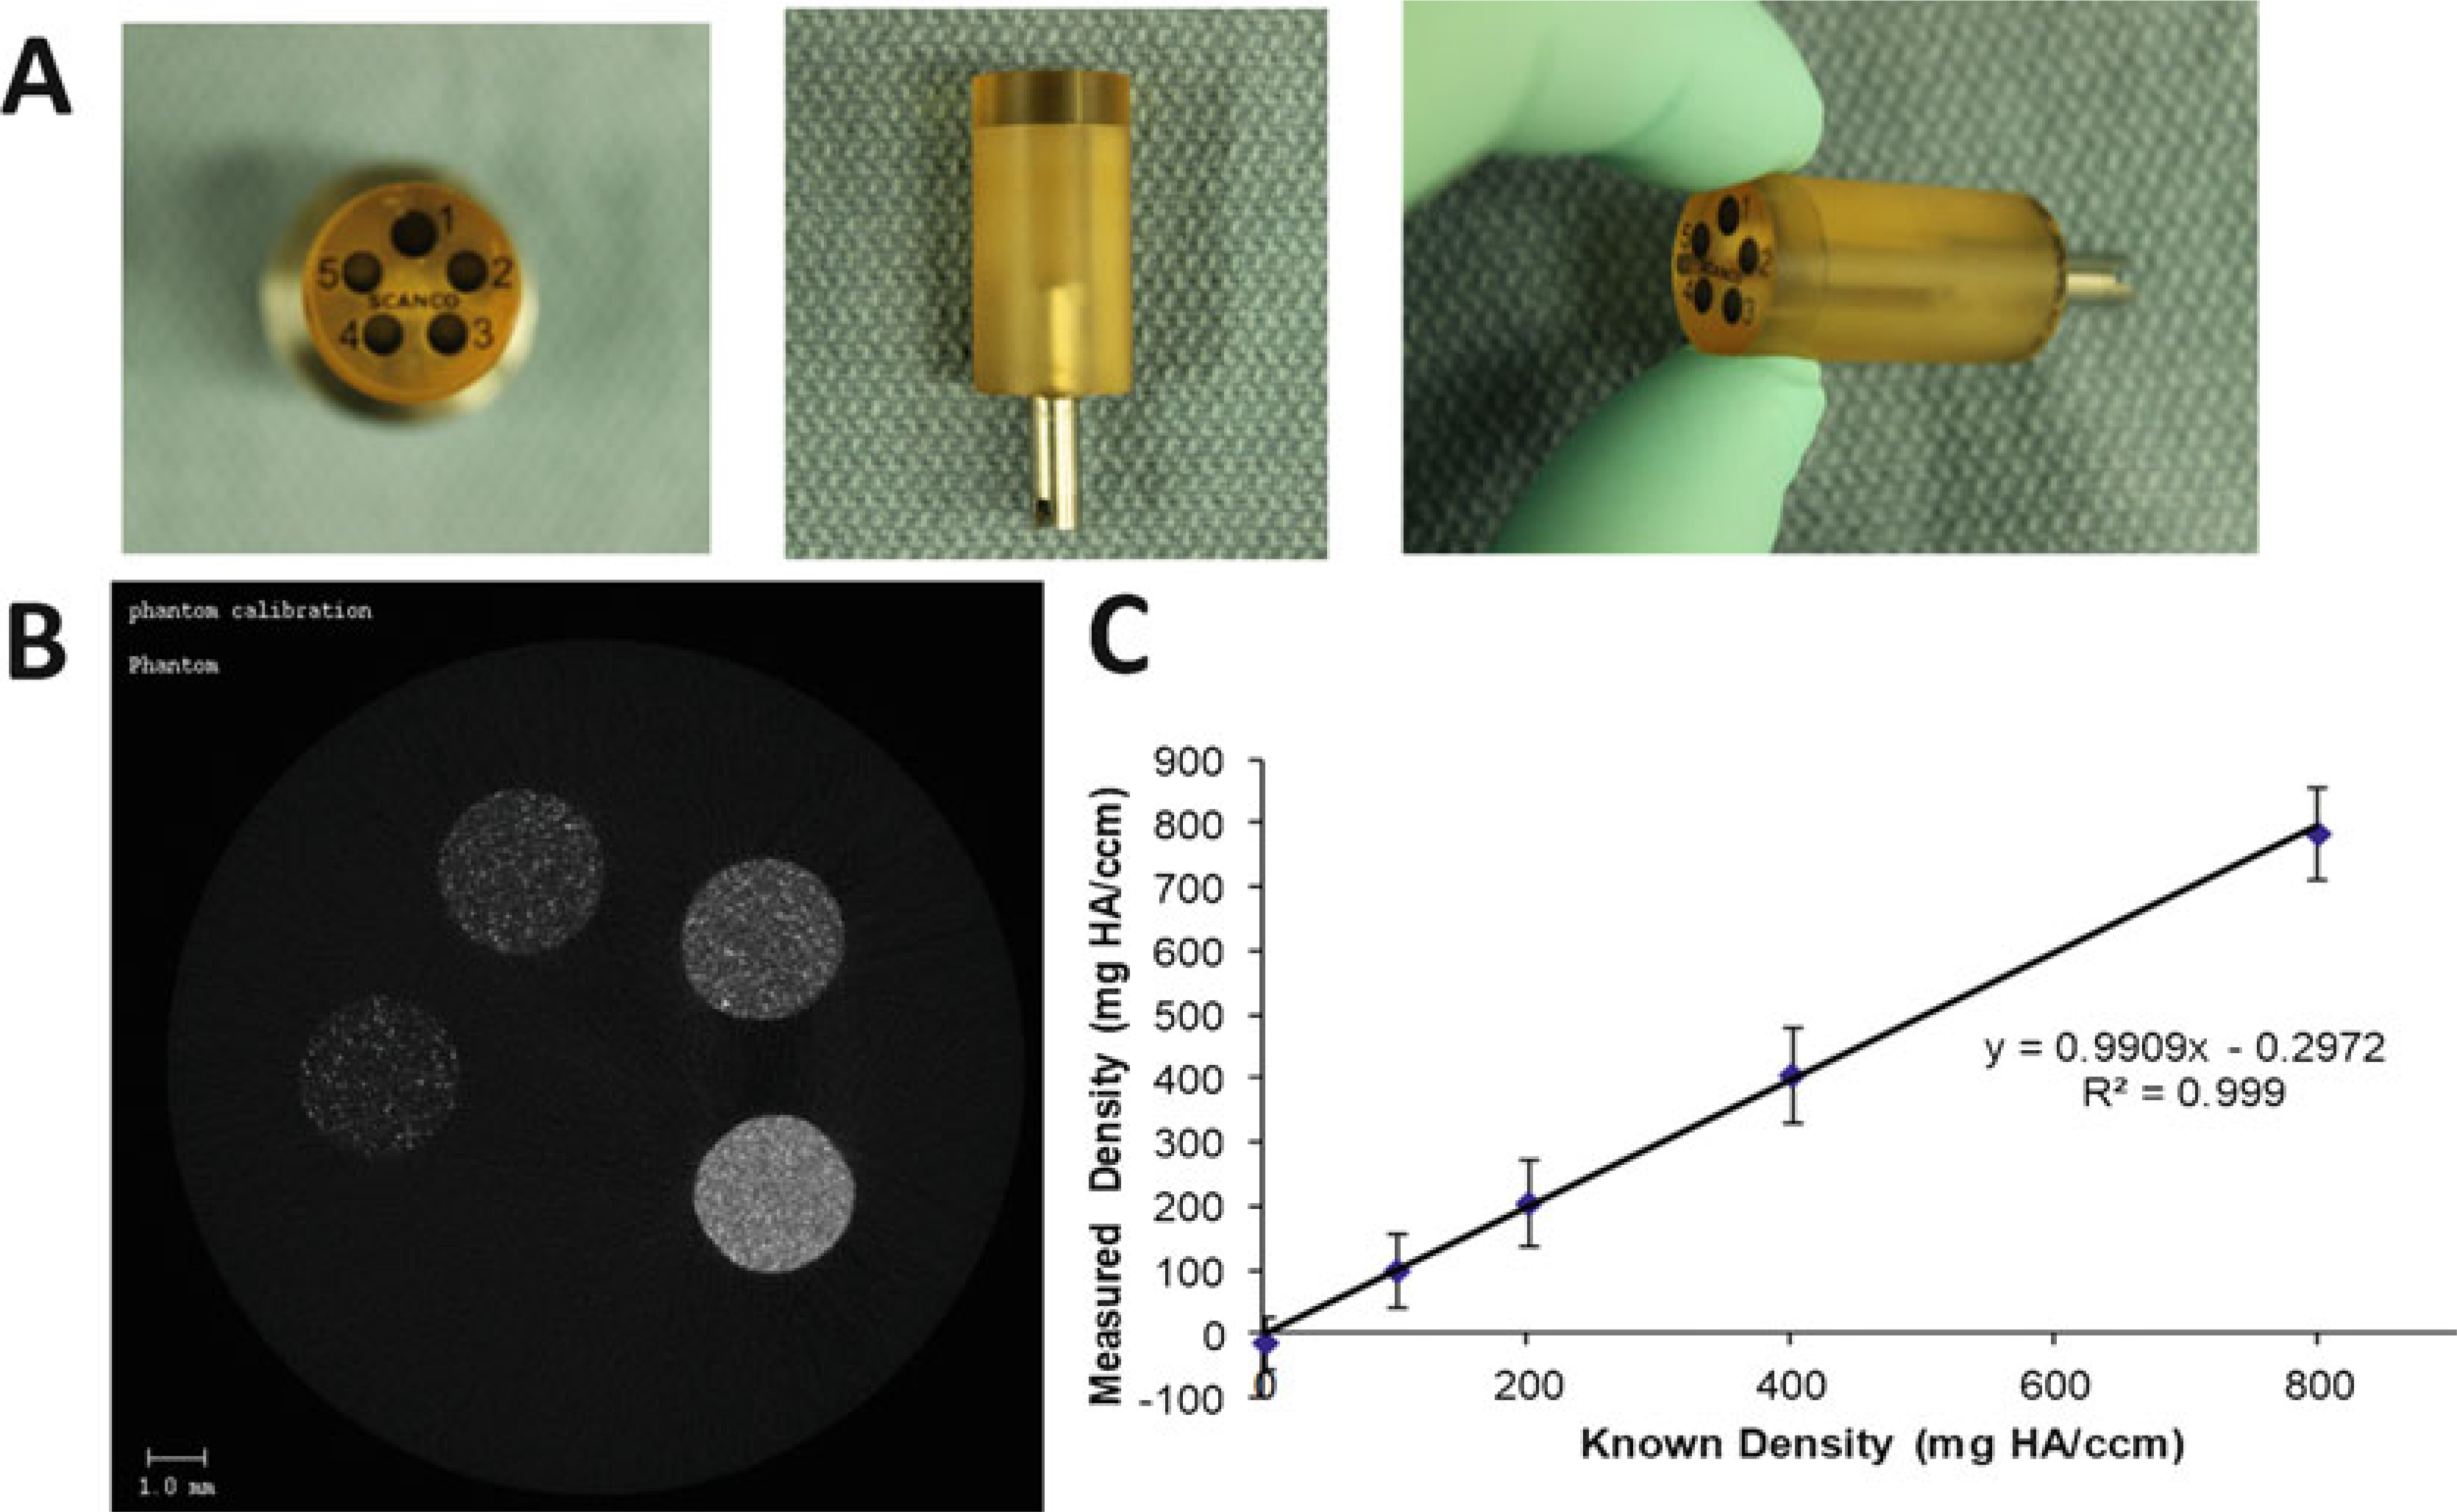
(a) Scanco Phantom Block. (b) CT slice of phantom shows the five rods of different densities. (c) Regression line from QC scan showing excellent agreement between known phantom density values, and values measured in the QC scan

(a) Scanco Phantom Block. (b) CT slice of phantom shows the five rods of different densities. (c) Regression line from QC scan showing excellent agreement between known phantom density values, and values measured in the QC scan