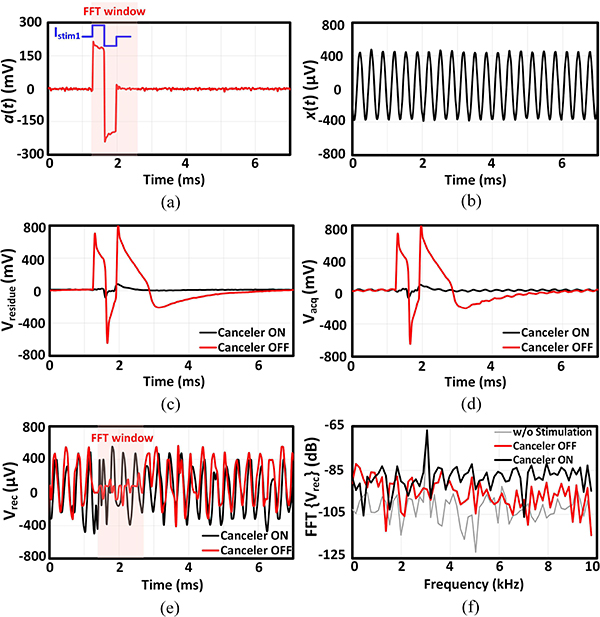
Fig. 15.
(a) Stimulation artifact. (b) Single-tone input signal. (c) Residual artifact waveform recorded during Φacq1. (d) Recorded signal contaminated with the residual artifact during Φacq2. (e) The recovered amplified input signal (The time window that the FFT is performed on is shown with a red rectangle). (f) Frequency spectrum of the recovered signal. The FFT of the recorded signal in the absence of the stimulation signal is also plotted. The representative waveforms are shown for channel 0.

