Fig. 1.

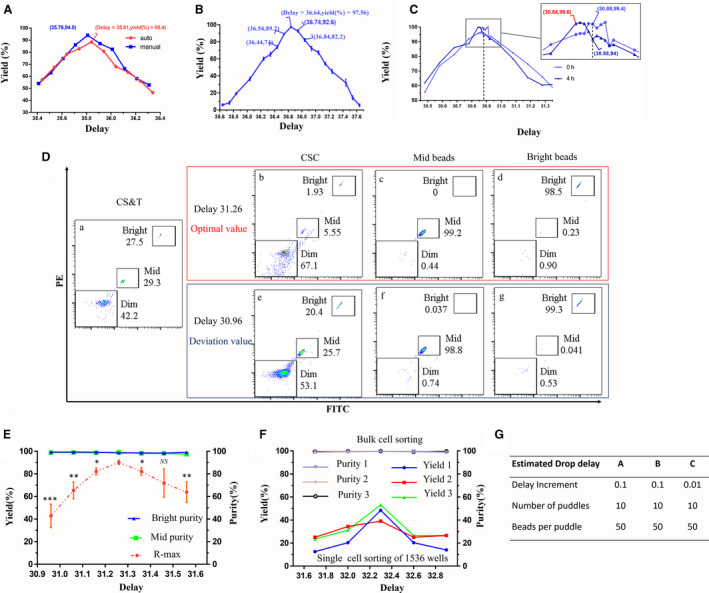
Effects of drop delay on the yield and purity of sorted cells and beads. The effect of drop delay on the yield of beads was tested. Each of the 10 puddles was collected using a drop delay setting with 0.1 intervals. Precisely 50 droplets were deposited into each puddle at different drop delay settings. (A) The effect of drop delay on the yield was tested with automatic and manually adjusted drop delays. The red line is the automatic one, and the blue line is the other one. (B) Map of the correlation between drop delay and yield. (C) Effect of long‐term sorting‐related drop delay deviation on yield. (D, E) The R‐max method was used to assess the effect of drop delay on yield and purity. CS&T beads consist of 3 μm bright or mid and 2 μm dim beads. According to the R‐max method reported, two beads of 3 μm bright or mid and central sheath catch (CSC) were sorted at the same time. After flow cytometry detection, the R‐max value and purity of two kinds of beads were analyzed. (D) Dot plots of flow cytometry detection. (a) Dot plots of CS&T beads. (b–g) Dot plots of CSC, mid and bright beads were sorted with delay value 31.26 (b–d, red frame) and 30.96 (e–g, blue frame). 31.26 is the optimal value. 30.96 is the value of deviation. (F) The yield and purity of cells were assessed under manually adjusted conditions. (G) The estimated drop delay for different experiments of testing drop delay changes. Jurkat cells stained with CFSE and Hoechst 33342 were mixed at 1 : 1 with unstained cells to obtain a suspension (1 × 10⁷ cells·mL−1). The double‐positive cells were sorted into 1536‐well plates. Then, each well of cells in the 1536‐well plate was scanned with a BioTek Cytation 1 Cell Imaging Multi‐Mode Reader and imaged individually. The data were analyzed by gen5 3.04 software (BioTek, Winooski, VT, USA). Data are presented as the mean ± SEM. n = 3. Each experiment was repeated at least three times. *P < 0.05, **P < 0.01, ***P < 0.001, NS: no significance, by one‐way ANOVA.
