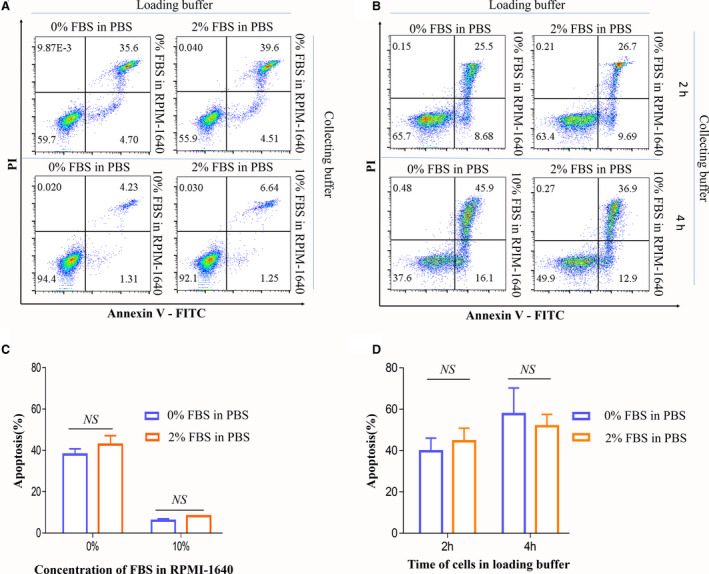
Fig. 2.

Effects of the addition of FBS in loading buffer on cell apoptosis. (A) Dot plots of apoptotic cells sorted with different loading and collecting buffers. (B) Dot plots of apoptotic cells sorted with different loading and collecting buffers after 2 and 4 h. Numbers in quadrants indicate the percentages of cells in each throughout. Cells were stained with Annexin‐V and propidium iodide and analyzed by flow cytometry. (C, D) The data of the percentage of apoptotic cells of three independent experiments. Data are presented as the mean ± SEM. n = 3. Each experiment was repeated at least three times. NS: no significance, by one‐way ANOVA.
