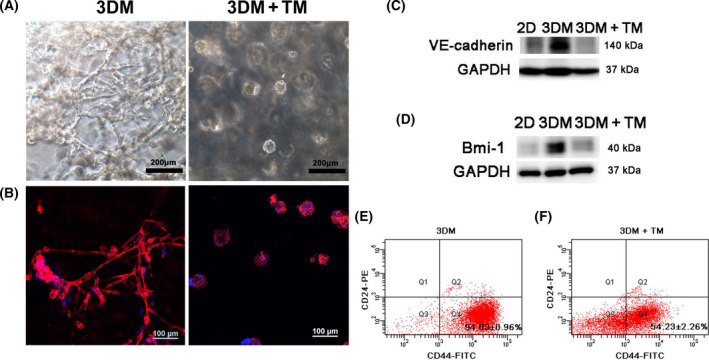
Fig. 2.

Phenotypic changes of MDA‐MB‐231 cells in 3DM after TM treatment. (A) Light microscope images of MDA‐MB‐231 cells in 3DM and TM‐treated 3DM (3DM+TM). Scale bars: 200 μm. (B) F‐actin (red) and nuclear (blue) DAPI fluorescence images of MDA‐MB‐231 cells in 3DM and 3DM+TM. Scale bars: 100 μm. (C, D) Western blot analysis of VM marker protein VE‐cadherin and stem cell marker Bmi‐1 of MDA‐MB‐231 cells in 2D, 3DM and 3DM+TM. (E) Flow cytometric analysis of surface markers CD24 and CD44 in 3DM MDA‐MB‐231 cells. (F) Flow cytometric analysis of surface markers CD24 and CD44 in 3DM MDA‐MB‐231 cells after TM treatment.
