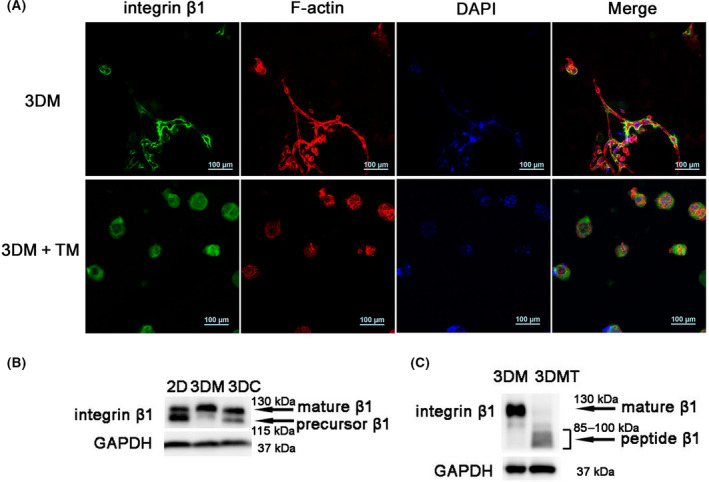
Fig. 3.

Changes in glycosylation of integrin β1 after TM treatment. (A) Integrin β1 (green), F‐actin (red) and nuclear (blue) DAPI fluorescence images and merged images of MDA‐MB‐231 cells in 3DM and TM‐treated 3DM (3DM+TM). Scale bars: 100 μm. (B) Western blot analysis of integrin β1 in MDA‐MB‐231 cells from 2D, 3DM and 3D collagen culture (3DC) groups. (C) Western blot analysis of integrin β1 in MDA‐MB‐231 cells before (3DM) after TM treatment (3DMT).
