
Fig. 4.
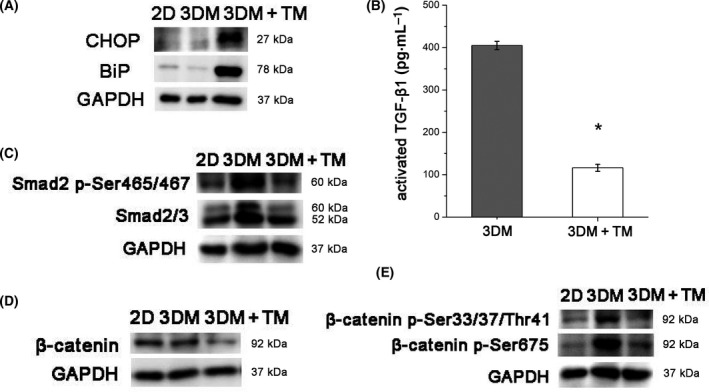
TM‐induced ER stress activation and the changes of TGF‐β1/Smad2/3 and β‐catenin signaling. (A) Western blot analysis of Bip and CHOP of MDA‐MB‐231 cells in 2D, 3DM and 3DM+TM. (B) Concentrations of activated TGF‐β1 of MDA‐MB‐231 cells in 3DM and 3DM+TM (*P < 0.05). Statistical significance was determined for experimental data by using the Student's t‐test. Error bars indicate SEM. All experiments were repeated three times. (C) Western blot analysis of Smad2/3 and Phospho‐Smad2 of MDA‐MB‐231 cells in 2D, 3DM and 3DM+TM. (D, E) Western blot analysis of total β‐catenin, active β‐catenin (p‐Ser675) and inactive β‐catenin (p‐Ser33/37/Thr41) in 2D, 3DM and 3DM+TM.