
FIGURE 3.
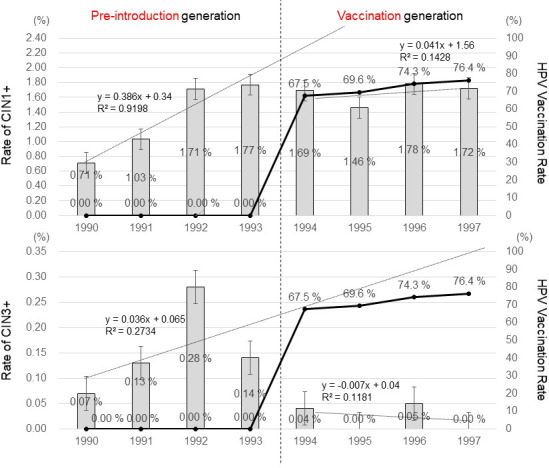
Changes over time (by birth FY) in the HPV vaccination rate and the incidence of CIN1+ and CIN3+ during cervical cancer screening at age 20. The line graph represents the cumulative rates of HPV vaccination in girls aged 16 y or younger, and the bar graph represents the incidences of CIN1+ and CIN3+. The regression lines and regression coefficients of changes in the incidence of CIN1+ and CIN3+ in the pre‐introduction generation and the vaccination generation are graphically illustrated. The rate of undergoing biopsy varied in accordance with the birth FY, for which the rate was adjusted by assuming that all girls with an abnormal cytology report subsequently underwent biopsy. For the pre‐introduction generation, x = 1 (FY 1990), x = 2 (FY1991), x = 3 (FY 1992), and x = 4 (FY1993). For the vaccination generation, x = 1 (FY 1994), x = 2 (FY1995), x = 3 (FY 1996), and x = 4 (FY1997)