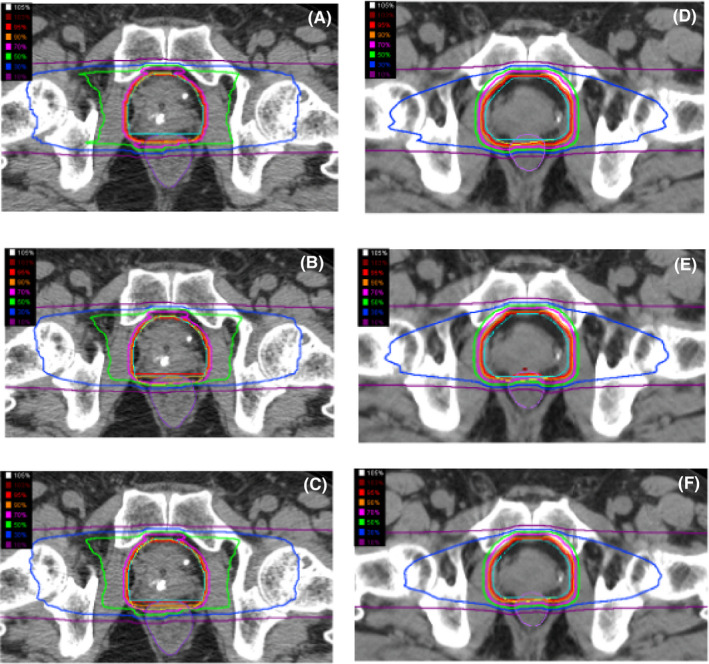
FIGURE 1.

The dose distributions of the passive beam [(A) first 8 times to planning target volume (PTV) 1, (B) the remaining 4 times for PTV2, and (C) the fusion of total 12 times] and the scanning beam [(D) first 8 times to PTV 1, (E) the remaining 4 times for PTV2, and (F) the fusion of total 12 times] used with carbon‐ion radiotherapy (CIRT). The penumbra around the target volume with a high dose area (more than 70%) is slightly sharper for the passive beam than the scanning beam, however, the region of low to middle dose area (30% to 70%) of the passive beam is wider than that of the scanning beam.
