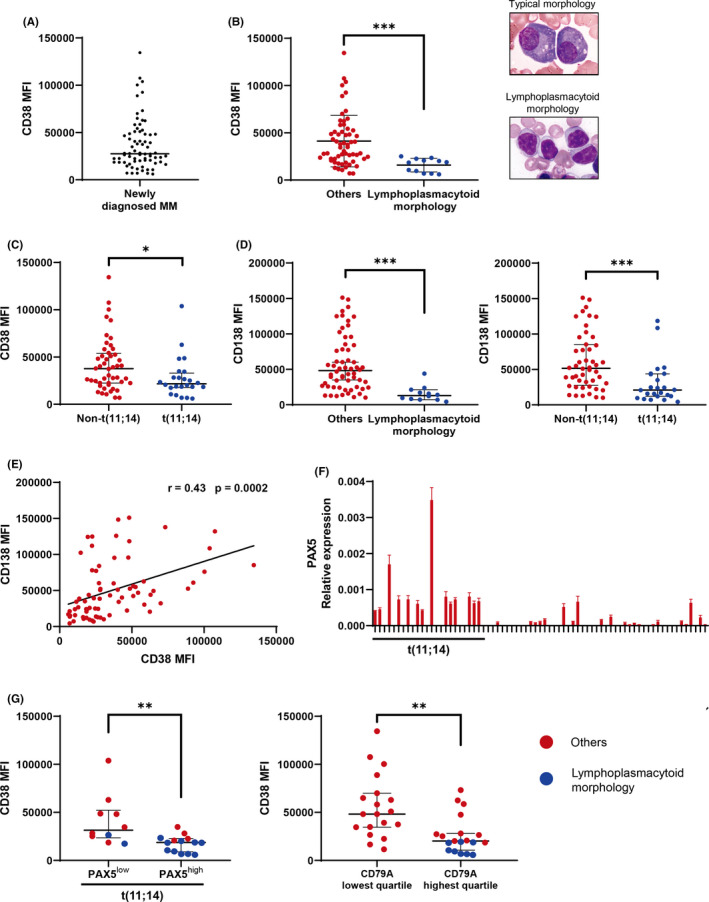
FIGURE 1.

CD38 expression is significantly lower in t(11;14)‐associated immature plasma cell morphology, especially in cells expressing B–cell‐associated genes. Asterisks denote significant changes (* .01 ≤ P < .05, **.001 ≤ P < .01, and ***P < .001); ns, not significant. A, Flow cytometry analysis of CD38 MFI in newly diagnosed multiple myeloma patients. Bars indicate the median. B, Comparison of CD38 MFI in myeloma patients with or without lymphoplasmacytoid morphology. Representative typical plasma cell morphology and lymphoplasmacytoid morphology are shown. Lymphoplasmacytoid morphology type was defined as the cases with reduced cytoplasm (nuclear cytoplasmic [N/C] ratio exceeding 0.6) and >25% tumor cells showing lymphoplasmacytoid morphology. Bars indicate the median with interquartile range. Significance was assessed by Mann‐Whitney U test. C, CD38 MFI in patients with or without t(11;14). Bars indicate the median with interquartile range. Significance was assessed by Mann‐Whitney U test. D, CD138 MFI in myeloma patients with or without lymphoplasmacytoid morphology and t(11;14). Bars indicate the median with interquartile range. Significance was assessed by Mann‐Whitney U test. E, The correlation between CD38 and CD138 MFI is shown; r: correlation coefficient. Significance was assessed by Spearman test. F, Real‐time quantitative RT‐PCR (qRT‐PCR) analysis of PAX5 in newly diagnosed multiple myeloma patients. Expression levels were normalized to that of GAPDH. Specific mRNA relative expression levels are presented as . X‐axis: case numbers. Y‐axis: values for PAX5 mRNA expression. Results are representative of 3 different experiments. Error bars represent the mean ± standard error of 3 independent experiments. G, CD38 MFI in myeloma patients with PAX5high or PAX5low expression, as defined by the PAX5 median value of all patients. CD38 MFI by CD79A expression is also shown. Blue denotes the cases with lymphoplasmacytoid morphology. Significance was assessed by Mann‐Whitney U test
