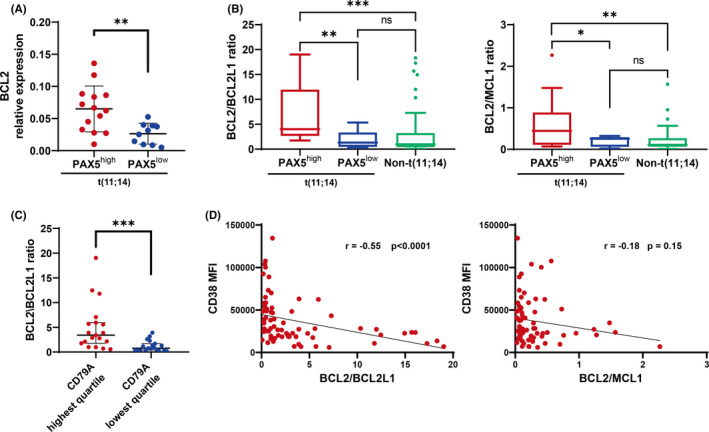
FIGURE 2.

The BCL2/BCL2L1 ratio was inversely correlated with CD38 MFI, and was significantly higher in t(11;14) patients expressing B–cell‐associated genes. Asterisks denote significant changes (*.01 ≤ P < .05, **.001 ≤ P < .01, and ***P < .001); ns, not significant. A, BCL2 relative expression in myeloma patients with PAX5high or PAX5low expression. Bars indicate the median with interquartile range. Significance was assessed by Mann‐Whitney U test. Expression levels were normalized to that of GAPDH. Specific mRNA relative expression levels are presented as . B, The BCL2/BCL2L1 ratio in patients with t(11;14) plus PAX5high or PAX5low , or without t(11;14). The BCL2/MCL1 ratio is also shown. Bars indicate the median with interquartile range. Significance was assessed by Kruskal‐Wallis test. C, The BCL2/BCL2L1 ratio in patients by CD79A expression. Bars indicate the median with interquartile range. Significance was assessed by Mann‐Whitney U test. D, Correlations between CD38 MFI and the BCL2/BCL2L1 ratio, and CD38 MFI and the BCL2/MCL1 ratio; r, correlation coefficient. Significance was assessed by Spearman test
