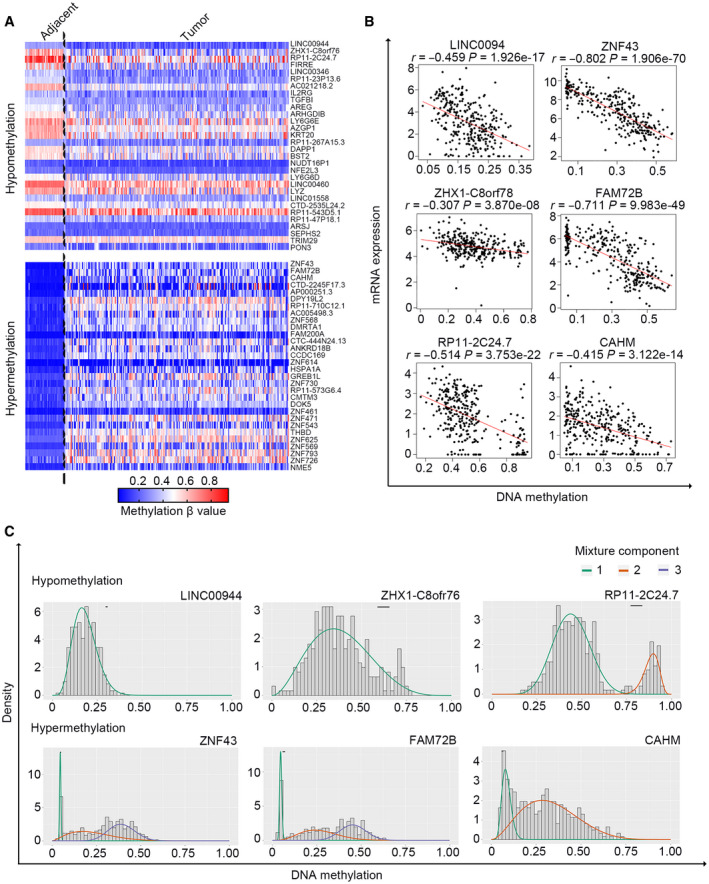
Fig. 1.

Screening for MDGs in CRC. (A) The methylation profile of the 30 most significant hypomethylated and hypermethylated MDGs in adjacent (n = 38) and CRC (n = 315) tissues. (B) The association between gene expression and DNA methylation of the top three hypomethylated and hypermethylated MDGs in CRC samples with both data available (n = 309). Pearson’s correlation analysis for each selected MDG was conducted (red line). (C) The mixture models of the top three hypomethylated and hypermethylated MDGs in adjacent (n = 38) and CRC samples (n = 315). The mixture components analyzed by the methylmix algorithm indicate the fitting curve of the distribution of the methylation values (β‐values) across all the samples (n = 353); the horizontal black bar represents the distribution of methylation values in the adjacent samples (n = 38).
