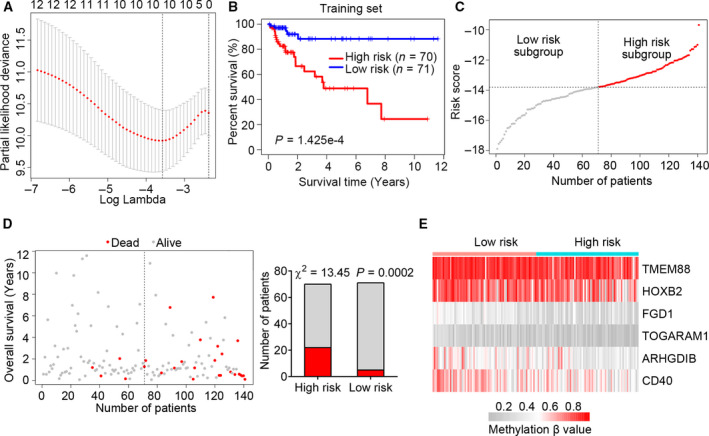
Fig. 2.

Identification of a prognostic six‐MDG panel in the training set. (A) Ten‐fold cross‐validation for tuning parameter selection in the LASSO model. The partial likelihood deviance corresponding to each lambda value was shown as mean ± SD. The dotted vertical line (left) indicates the optimal value by minimum criteria. (B) The Kaplan–Meier estimate of the OS using the six‐MDG panel in the training set. Patients with CRC were divided into high‐ (n = 70) and low‐risk (n = 71) subgroups based on the median risk score value. The difference between the two curves was determined by the two‐sided log rank test. (C) The distribution of risk scores derived from the six‐MDG panel applied to the training set. (D) The distribution of the survival status of patients with CRC in the training set. The difference between the high‐ and low‐risk subgroups was determined using the Chi‐square test. (E) The methylation profile of the six MDGs in the training set.
