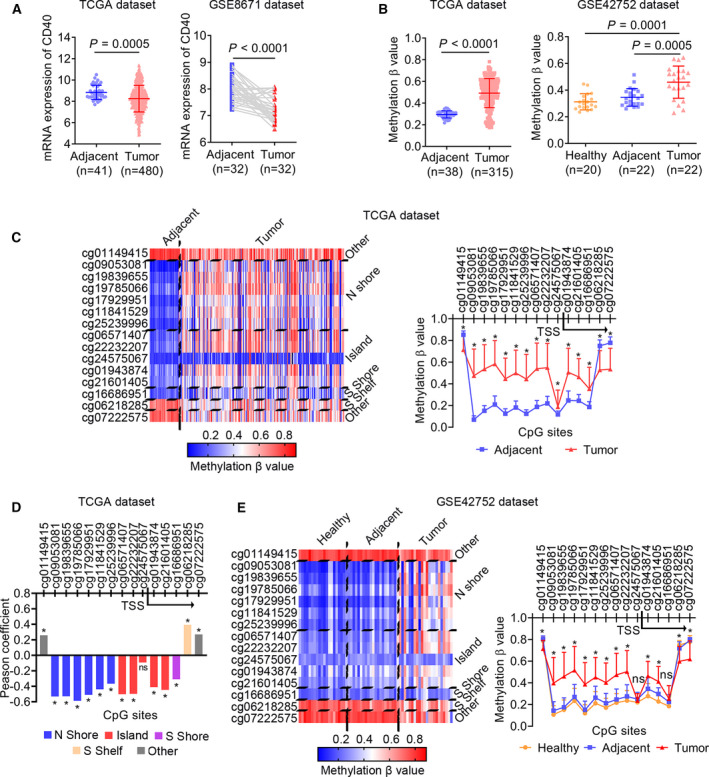
Fig. 6.

CD40 is universally hypermethylated in CRC tissues. (A) Scatterplots of CD40 mRNA expression between CRC and adjacent tissues from TCGA and GSE8671 dataset. The Mann–Whitney test was used to determine the significance of the comparison. (B) Scatterplots of CD40 DNA methylation (β‐value) between CRC and adjacent tissues from TCGA dataset and among healthy, CRC and adjacent tissues from GSE42752 dataset. The Mann–Whitney and Wilcoxon matched‐pairs signed‐rank tests were used to analyze the differences between nonpaired and paired samples, respectively. (C) The methylation profile for all of the CpGs (n = 15) of CD40 in CRC samples from TCGA dataset. The differences in CpG sites' methylation levels between tumor and adjacent tissues were determined by the Mann–Whitney test. (D) The Pearson’s coefficient correlations between CD40 mRNA expression and methylation levels of all 15 CpG sites. (E) The methylation profile for all of the CpGs (n = 15) of CD40 in CRC samples from the GSE42752 dataset. The differences in CpG sites' methylation levels between tumor and adjacent tissues were determined using the Mann–Whitney test. *P < 0.05. ns, no significance.
