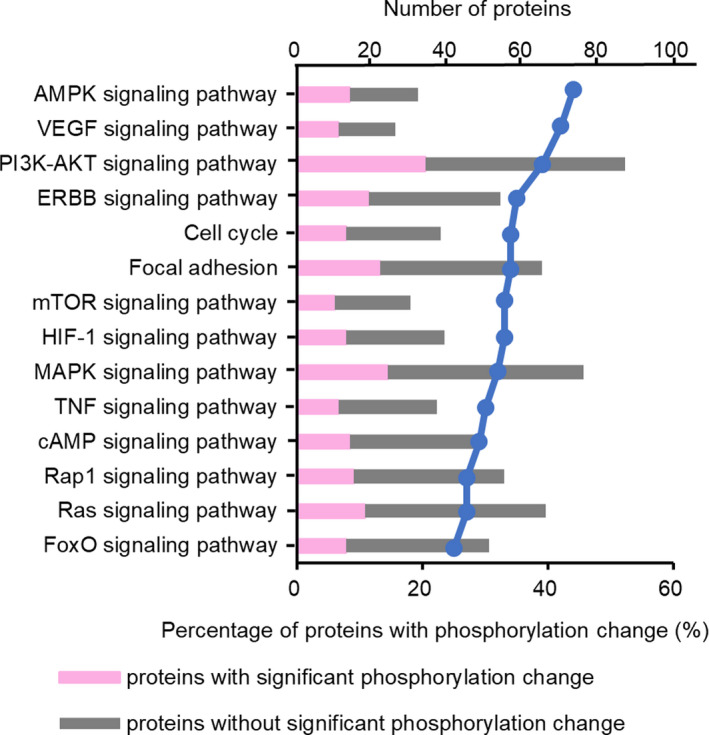
FIGURE 3.

Pathway functional annotations of proteins with altered phosphorylation levels induced by miR‐193a‐3p overexpression. Percentage of proteins with phosphorylation change divided by all analyzed proteins in each pathway is represented by line plot
