
FIGURE 2.
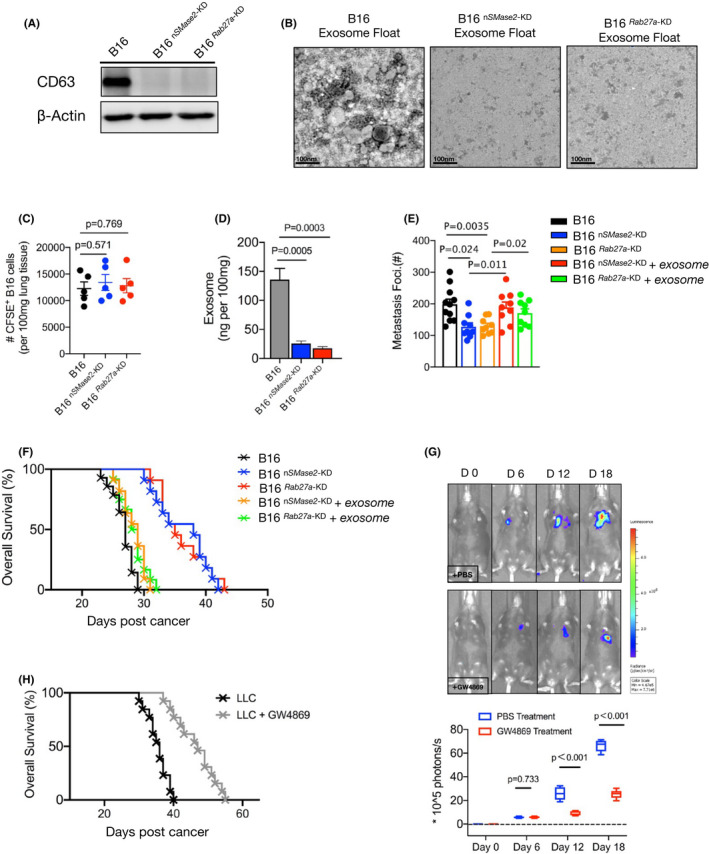
Tumor‐released exosome was critical promotor for metastasis. A, Western blot analysis of exosomes from WT, 2 mutated (Rab27a‐KD and nSMase2‐KD) B16 cells. B, Electron microscopy images of WT and Rab27a‐KD and nSMase2‐KD B16 cells, purified by gradient centrifugation. C, Number of CFSE‐labeled WT and Rab27a‐KD and nSMase2‐KD B16 cells present in the lungs of mice 2 h after administration. D, Melanoma cells were sorted from metastatic mice and were cultured in vitro, also shown as Figure 1. The levels of exosome purified from cultured supernatant were measured by ELISA (n = 4), shown as ng per 100 mg weight of lung tissue. E, WT B16 were injected with C57BL/6J mice, after 16‐18 d, exosomes were isolated from peripheral blood using an isolation kit. On days 6, 10, or 14, the purified exosomes were adoptively transferred to mice bearing knockdown B16 cells. The numbers of metastases foci of mice were counted under a dissection microscope on day 16. See also Figure S2C. F, Survival curve of control or metastatic mice treated with or without additional purified exosomes. WT vs Rab27a‐KD, P < .001; WT vs nSMase2‐KD, P < .001; WT vs Rab27a‐KD plus exosomes, P = .068; WT vs nSMase2‐KD plus exosomes, P = .062. log rank test was used. G, C57BL/6J mice were intravenously injected with B16‐luc cells. The inhibitor of exosome, GW4869, was performed as described in Materials and Methods from day 6 of tumor inoculation. Luciferin was administrated on days 0, 6, 12, and 18, and light emission was recorded. Representative bioluminescence images are shown; PBS, n = 7; GW4869, n = 9. Unpaired t test was used. H, Mouse survival curve following injection of LLC cells as in (F), control mice (n = 9) vs treated mice (n = 12), P < .001(log rank test). In (C‐E), one‐way ANOVA with Bonferroni correction was used. The experiments were performed at least twice with similar results. Error bars, SEM