
FIGURE 5.
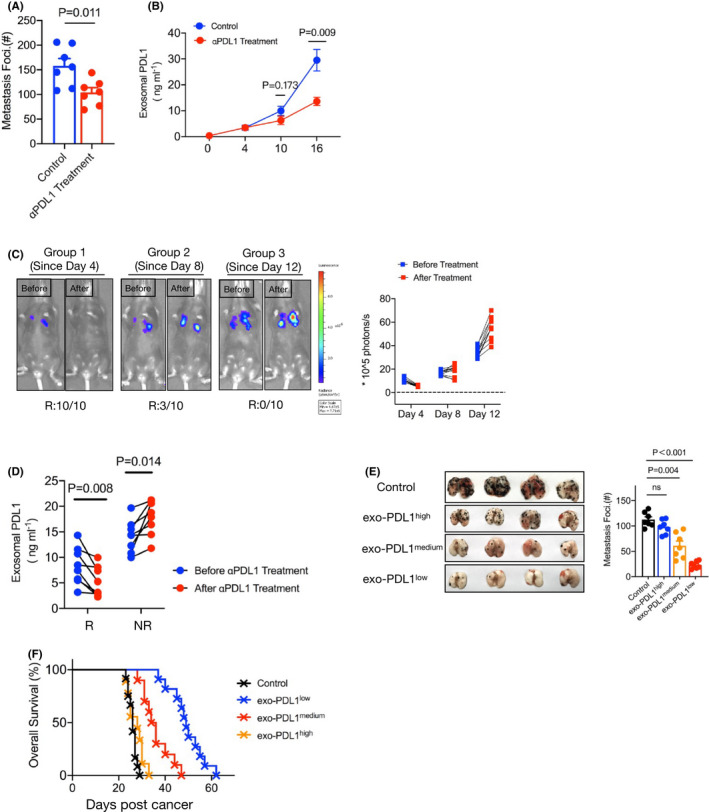
Exosomal PD‐L1 was a potential biomarker for predicting metastasis progression. A, C57BL/6J mice were treated with or without antibody targeted on PD‐L1 at 6, 9, and 12 d post‐WT B16 cells injection. A summary of metastases of mice is shown. n = 7 for each tumor group. B, Levels of PD‐L1 on exosomes in plasma samples of control or anti‐PD‐L1 antibody treatment mice, measured by ELISA. Unpaired t test was used in (A, B). Error bars, SEM. C, C57BL/6J mice were intravenously injected with B16‐luc cells on day 0. The anti‐PD‐L1 antibody was performed from day 4 (Group 1: on days 4, 7, 10), day 8 (Group 2: on days 8, 11, 14) or day 12 (Group 3: on days 12, 15, 17) of tumor inoculation. Luciferin was administrated on day 18, and light emission was recorded. Representative bioluminescence images are shown. The ratio of responder (R) or nonresponders (NR) for blockade was summary by bioluminescence intensity. n = 10 for each tumor group. D, Tumor‐bearing mice were treated with anti‐PD‐L1 antibody from day 8 (on days 8, 11, 14). ELISA to measure the levels of exosomal PD‐L1 in R and NR on day 7 and day 15 (paired t test). E, Images (left) and summary (right) of metastases of high (≥25 ng/mL), medium (between 5 and 25 ng/mL), and low PD‐L1 (≤5 ng/mL) on circulating exosomes. Each group of mice was administrated anti‐PD‐L1 blockade 3 times. One‐way ANOVA with Bonferroni correction was used. F, Mouse survival curve for high, medium, and low exosomal PD‐L1 of mice treated with anti‐PD‐L1 antibodies. Isotype antibody treatment mice served as the control. Control vs high, P = .874, Control vs medium, P = .004; Control vs low, P < .001(log rank test). The experiments were repeated at least twice with similar results