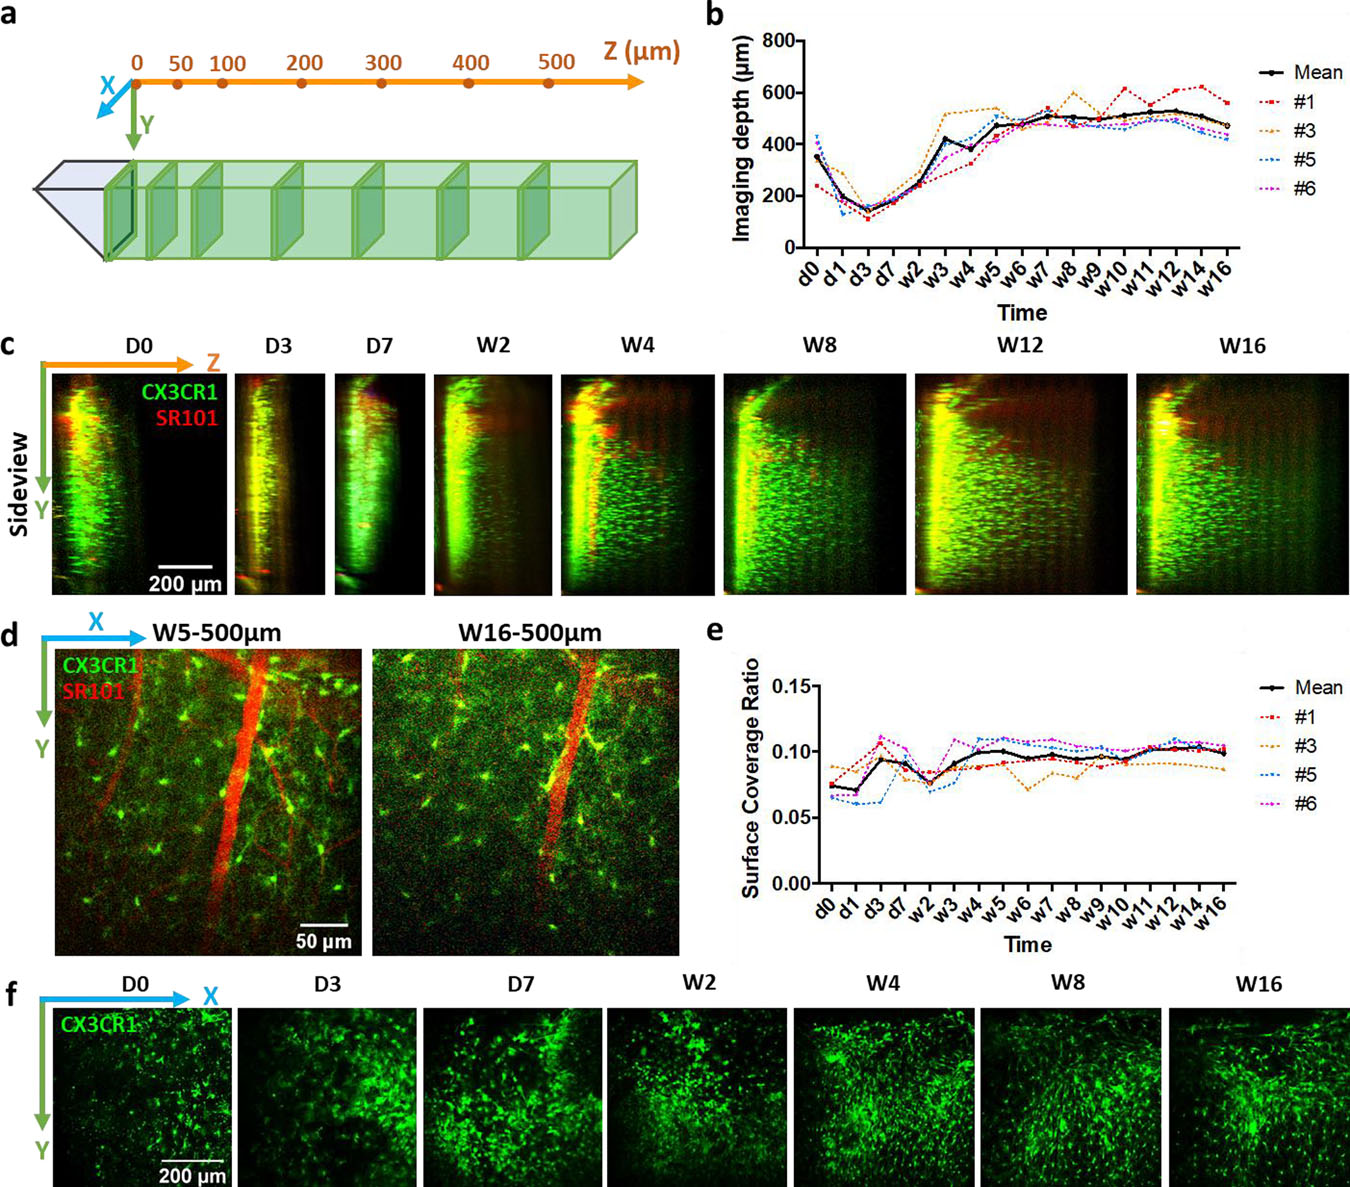
Figure 3. Image clarity after microprism implantations.

(a) Schematics of imaging configuration. Following two-photon images are projected from thin slices (30 μm thick) at a series of z locations. (b) Measurements of maximum imaging distance in the Z direction over time. Colored lines represent animal #1, #3, #5 and #6 in (b) and (e). (c) Representative side-projections of two-photon image stacks at different time points after microprism implantations. Green: CX3CR1-GFP; Red: intravascular dye (SR101). (d) Representative two-photon images showing microglia (green) and vasculature (red) at 500μm from microprism surface at week5 and week16 post implantation. (e) Characterization of coverage ratio by CX3CR1-GFP cells at microprism surface. (f) Representative two-photon images at microprism surface showing the change of microglia/macrophage coverage in one animal over time.
