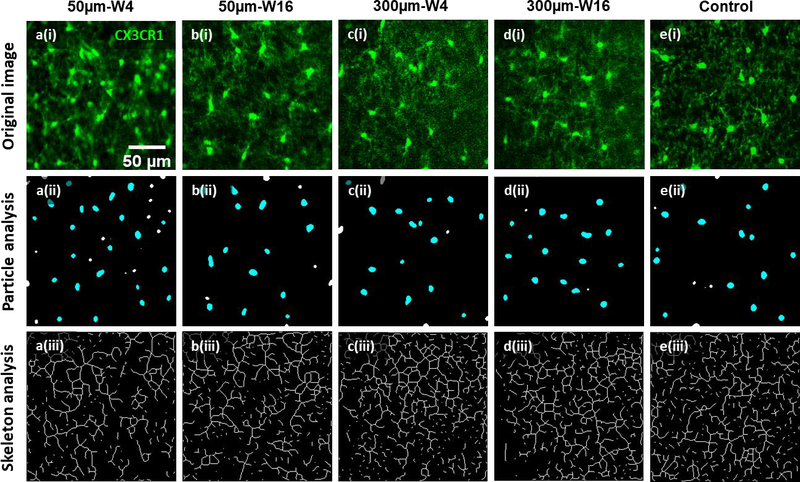
Figure 4. Representative microglial morphology and graphical analysis results after chronic microprism implantations.

First row: representative two-photon images of microglia at 5μm (a(i) & b(i)) and 300μm (c(i) & d(i)) from the microprism surface and at week4 (a(i) & c(i)) and week16 (b(i) & d(i)) post microprism implantation. Representative control image (e(i)) is taken immediately after creation of acute craniotomy. Green: CX3CR1-GFP. Images in the same column are originated from the same image. The second row are particle analysis of images in the first row for microglial soma quantifications (soma density and area in figure 5). Cyan particles are counted for cell soma analysis, while the white particles are excluded because of undersize or incomplete shape (on the edges). The third row are skeleton analysis of images in the first row for quantification of microglial processes (processes length and junction numbers in figure 5). Notice that only the images at 50μm and week4 show obvious higher density, smaller soma, shorter processes, and less processes junctions of microglia compared to controls of acute craniotomy. Microglia at later time point (50μm-W16) or at distant regions (300μm-W4 & 300μm-W16) appear similar to the control.
