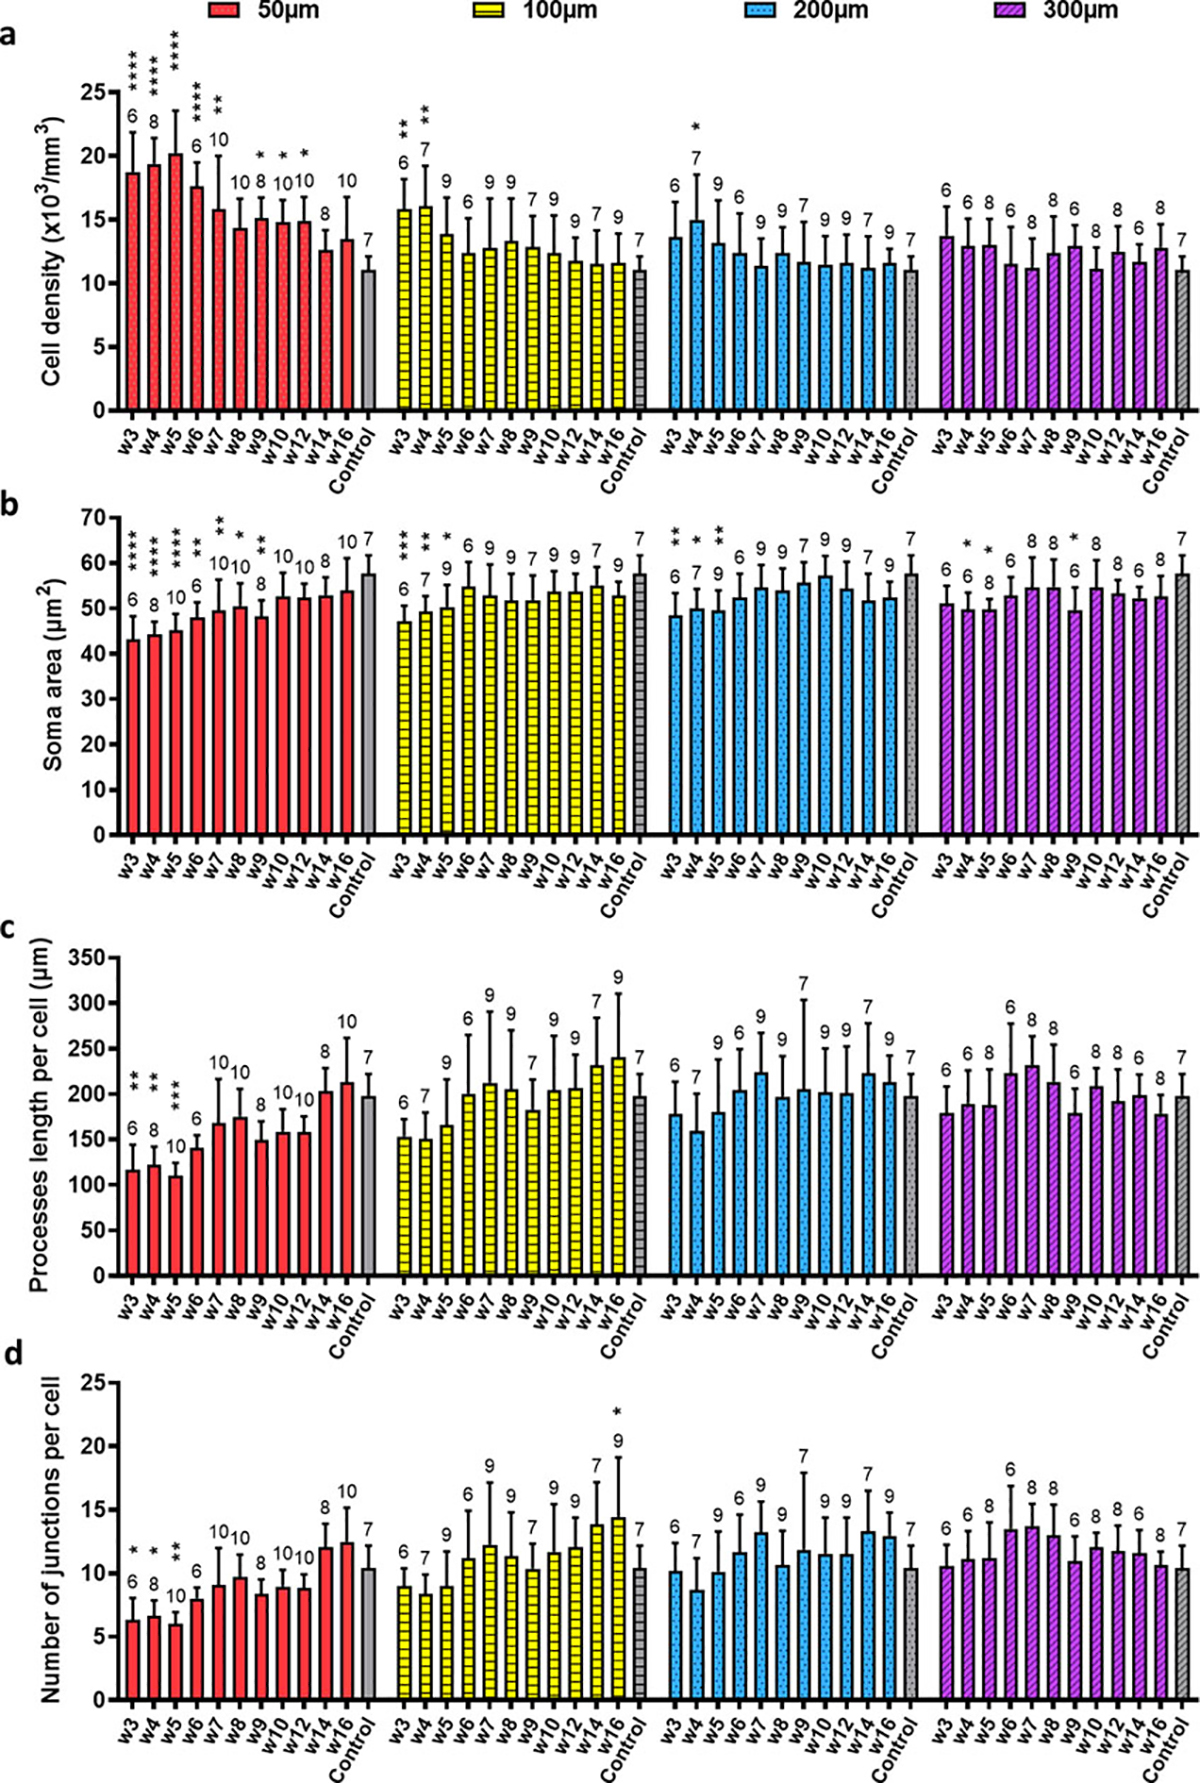
Figure 5. Quantification of microglial morphology after microprism implantation in comparison to non-implanted control.

(a) Quantifications of microglial density based on particle analysis. Control: acute non-implant craniotomy. Two-way ANOVA suggests that the two factors—time after implantation and distance from the microprism—both significantly affect the microglial density (p<0.0001), and there is an interaction effect (p=0.0186). Dunnett’s multiple comparisons which compare every time point to the control within each distance reveal significant higher microglial density at multiple early time points at 50μm, week3 and week4 at 100μm, and week4 at 200μm than the acute craniotomy control. For all the panels in this figure, *: p<0.05, **: p<0.01, ***: p<0.001, ****: p<0.0001, the unmarked bars are not significantly different from the control. N=6~10 regions (200 × 200 μm2 each) analyzed in each group from 4 animals for both the microprism implanted and the control. The exact number of regions analyzed are shown above each bar. Data are presented as mean ± SD. (b) Quantifications of projected area of microglial soma based on particle analysis. The same two-way ANOVA followed by Dunnett’s multiple comparisons is used in (a)~(d). The time factor and the distance factor are significant (p<0.0001), while the interaction of these two factors is not (p=0.5056). In the post-hoc tests, the soma size from week3 to week9 at 50μm are significantly smaller than the control, as well as week3 to week5 at 100μm and 200μm, and week4, 5, 9 at 300μm. (c) Quantifications of average processes length per cell. The time factor and the distance factor are significant (p<0.0001), while the interaction of these two factors is not (p=0.1932). (d) Quantifications of processes junctions per cell. The time factor and the distance factor are significant (p<0.0001), while the interaction of these two factors is not (p=0.0575).
