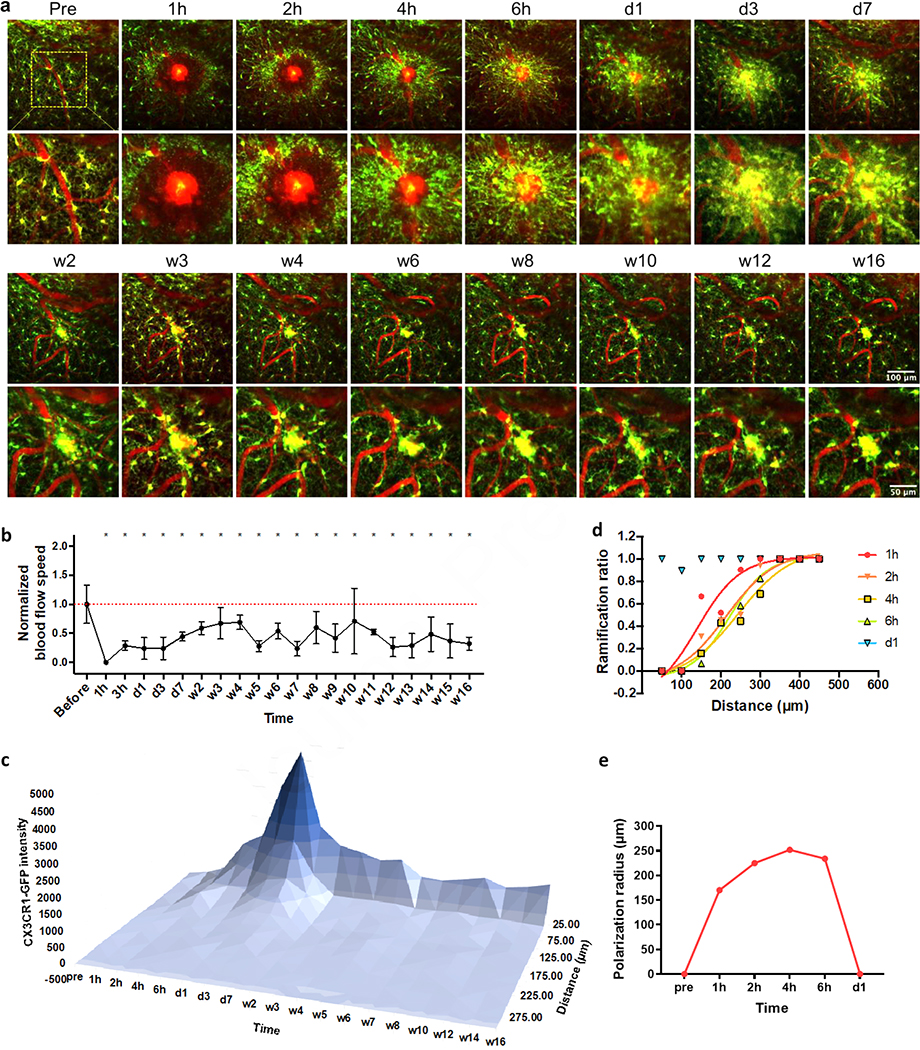
Figure 7. Prolonged microglia activation to micro-blood vessel hemorrhage.
(a) Representative images at the damage plane overtime. Green: CX3CR1-GFP; Red: SR101. (b) Blood flow stopped quickly and remained significant lower post hemorrhage. One-way ANOVA followed by Dunnett’s multiple comparisons test comparing every time point to pre-insult group. Data were presented as mean ± SD. N=6 to16 measurements from two biological replications. (c) Microglia intensity stayed high around damaged site over 16 weeks. Data were presented as the mean value from two biological replications. (d) Ramified microglia ratio over distance to the insult. Lines: Boltzmann sigmoidal fitting to the ramification ratio of pooled microglia from two biological replications. (e) Polarization radios (the distance where the ramification ratio reaches 0.5 in the sigmoidal fitting) changes over time.

