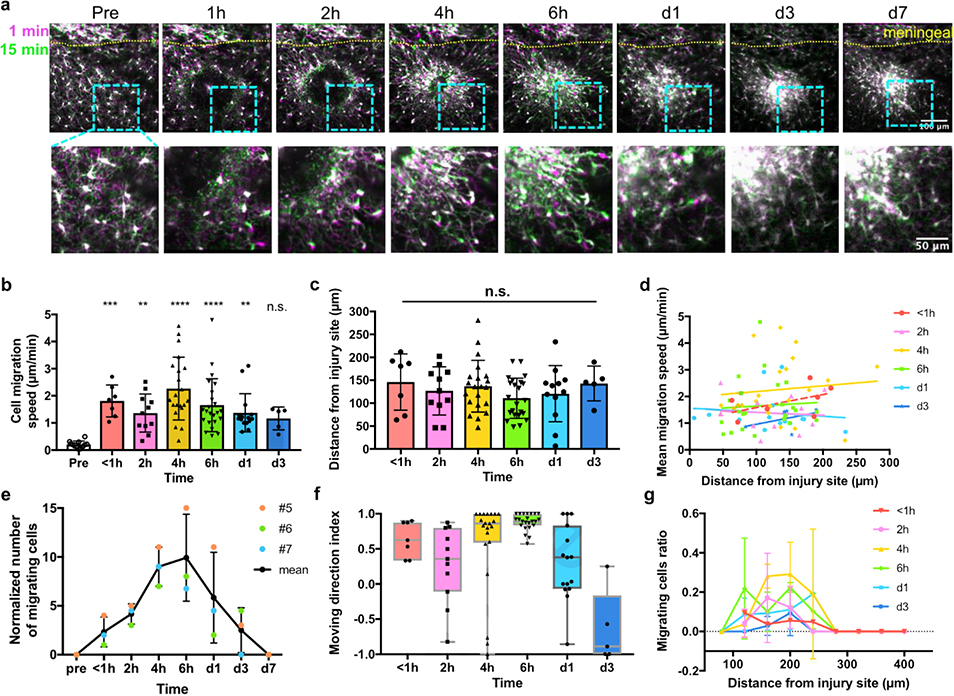
Figure 8. Microglial migration in the first week post micro-blood vessel hemorrhage.
(a) Dynamics of CX3CR1-GFP cells post hemorrhage injury. Magenta: the first frame of the time-lapse images; green: 15 min later. Lower row: magnified image of the light blue inset above. (b) Migration speed of microglia before and after the hemorrhage. One-way ANOVA followed by Dunn’s multiple comparisons test comparing every time points to the pre-insult group. N=12, 7, 11, 21, 23, 15 and 5 cells in time sequence from 3 animals for (b)~(f). (c) The distance between each migrating microglia and the injury site. One-way ANOVA, n.s.: no significance. (d) Microglial migration speed is independent from the distance from the injury site. Lines: linear regression fitting. All the slopes were not significantly different from zero (p=0.2403, 0.8282, 0.6510, 0.7681, 0.6681, 0.4616, respectively). (e) The number of migrating CX3CR1-GFP cells in the same imaging view over time. #5, #6, and #7: animal labels. Data were presented as mean ± SD. (f) The mean moving direction index of migrated cells. Boxes presented median ± quartile and whiskers covered min to max. (g) The ratio of migrating cells in all microglia over distance from the insult. Data were presented as mean ± SD. N=1 to 3 calculated ratios from 3 animals.

