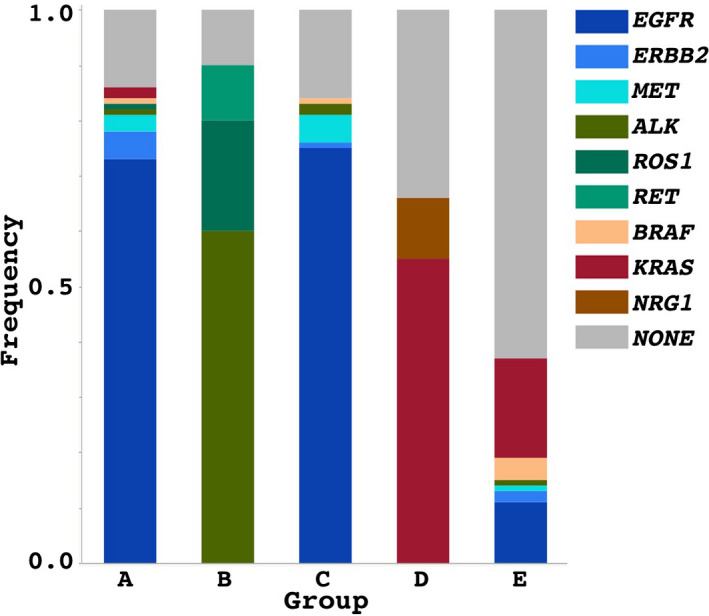
FIGURE 3.

Frequencies of driver mutations are shown in each of the groups. A difference in the driver mutations is remarkable between the groups. EGFR mutations are mostly seen in groups A and C, ALK and ROS1 mutations are seen in group B, and KRAS mutations are more commonly seen in group D, followed by group E
