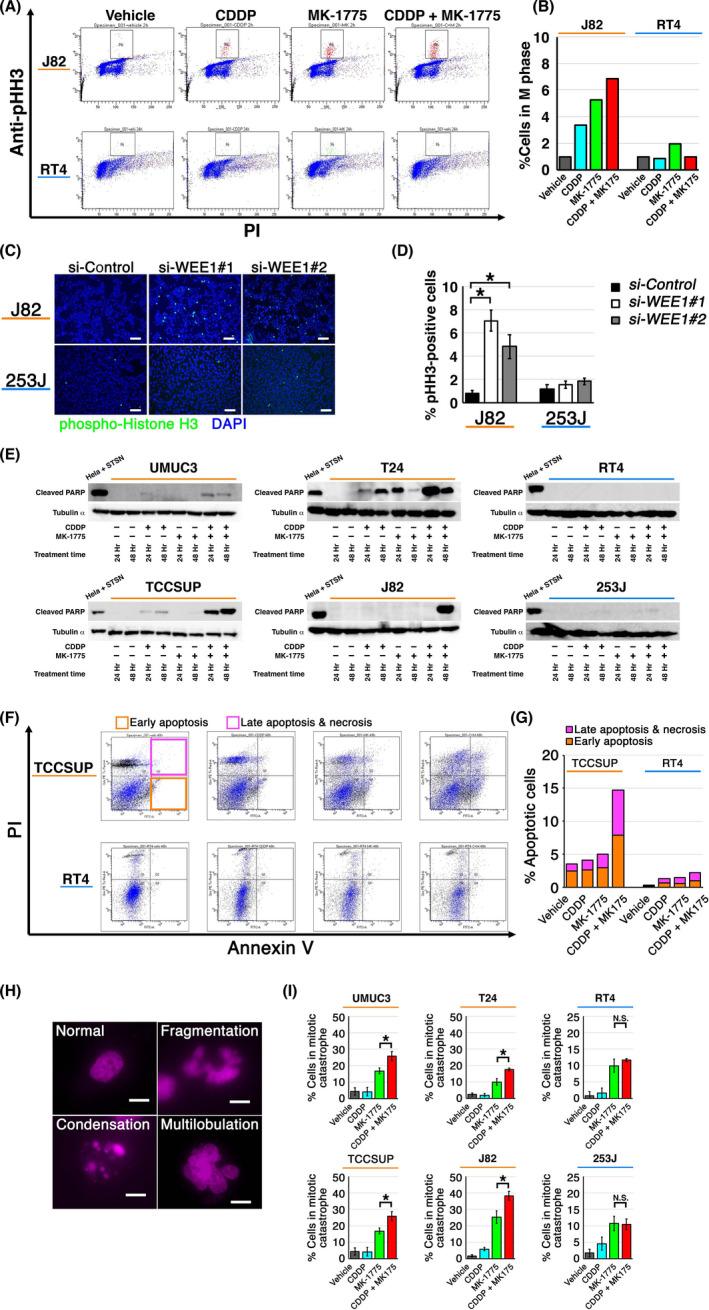
FIGURE 3.

Effect of WEE1 blockade with or without cisplatin (CDDP) on cell cycle and cell death in human urothelial cancer (UC) cells. A, J82 (top) and RT4 (bottom) cells were treated with the indicated drugs for 24 h and then sorted to quantify the M‐phase population defined by phospho‐histone H3 (pHH3)‐high population (gated). B, Proportion of cells in M phase after indicated treatments. Values are normalized to that of vehicle‐treated cells. C, Representative images of immunofluorescence assays carried out using anti‐pHH3 Ab. Cells were transfected with indicated siRNAs and incubated for 48 h. Bar, 100 μm. D, Chart for the proportion of pHH3‐positive cells treated as in (C). Quantitative analysis was performed using five randomly selected microscopic fields. Values were normalized to that for si‐Control. *P < .05. E, UC cell lines were treated as indicated and the expression of cleaved PARP was determined using western blot. HeLa cells treated with 2 μM staurosporine for 4 h served as the positive control. F, TCCSUP (top) and RT4 (bottom) cells were treated with the indicated drugs and then stained with propidium iodide (PI) and annexin V. Cells in early apoptosis and those in late apoptosis or necrosis were gated as indicated. G, Proportion of apoptotic cells treated as in (F). H, Representative fluorescent images of cells in mitotic catastrophe, defined by nuclear fragmentation or multilobulation. Bar, 10 μm. I, Proportion of cells in mitotic catastrophe. Cells were treated with indicated drugs for 24 h in triplicate, fixed and stained with DAPI. Five randomly selected microscopic fields were used for quantification. *P < .05
