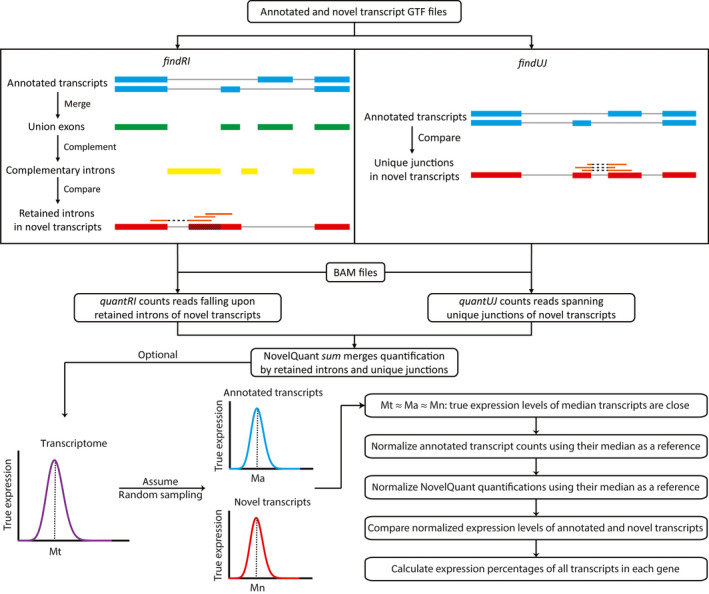
FIGURE 2.

Schematics of NovelQuant. findRI first merges exons of all transcripts (blue) in each gene to form union exons (green), and accordingly finds the complementary introns (yellow) that are then compared with the novel transcript (red) to discover the retained introns (shaded). findUJ compares all the exon‐exon junctions between annotated (blue) and novel (red) transcripts to find the junctions that are uniquely present in the novel transcript. Finally, quanRI and quanUJ count reads (orange) on the retained introns and unique junctions for input BAM files, and the sum mode merges the read counts that are then corrected for the total sequencing depth of each sample. Optionally, NovelQuant can be used to calculate expression percentages of transcripts in each gene. The annotated and novel transcript expression data are assumed to be two random samplings from the transcriptome, so they follow similar distribution and the corresponding medians are close (Mt ≈ Ma ≈ Mn), and hence median transcripts are selected as references for normalization. Once annotated transcript counts and NovelQuant quantifications are normalized separately for their references, the normalized expression levels of annotated and novel transcripts can be compared, and the expression percentages in each gene can be calculated. GTF, gene transfer format
