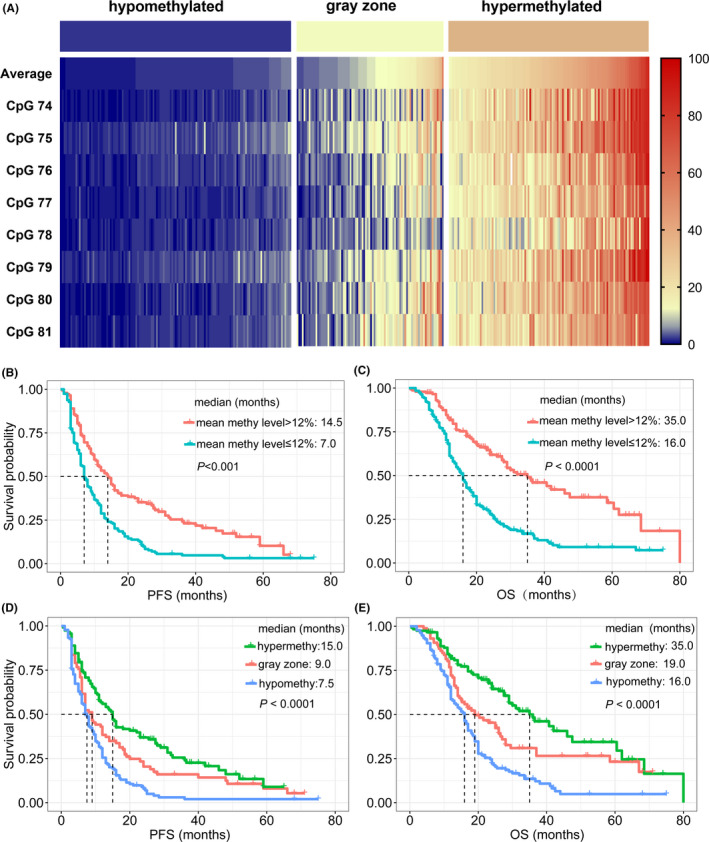
FIGURE 2.

(A) Heatmap for methylation levels amongst CpGs 74‐81 in hypomethylated, gray zone, and hypermethylated groups of glioblastoma patients. (B, C) The optimal threshold (12%) for average methylation levels could effectively predict survival, in terms of (B) progression‐free survival (PFS) and (C) overall survival (OS). (D, E) An intermediate prognosis was observed for patients in the gray zone (PFS in (D) and OS in (E))
