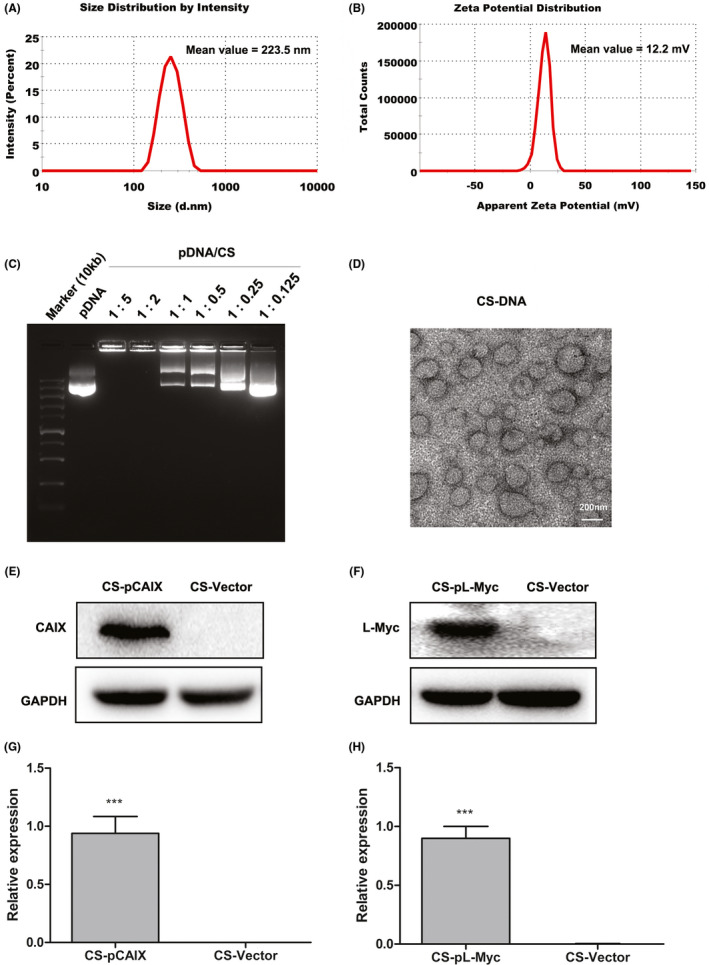
FIGURE 1.

Characterization of CS‐DNA nanoparticle vaccine. (A) Size intensity curves. (B) Surface zeta potential. (C) Gel blocking analysis of CS‐DNA. (D) The micrographs of CS‐DNA nanoparticles were acquired by transmission electron. Scale bars, 200 nm. (E and F) The expression of L‐Myc or CAIX was detected by western blot in muscular tissues from mice immunized with CS‐pL‐Myc or CS‐pCAIX. CS‐Vector was used as the corresponding control. (G and H) Quantification of L‐Myc or CAIX expression by densitometry in (E) and (F). Data are from one representative experiment of three performed and presented as the mean ±SD. The different significance was set at ***P <.001
