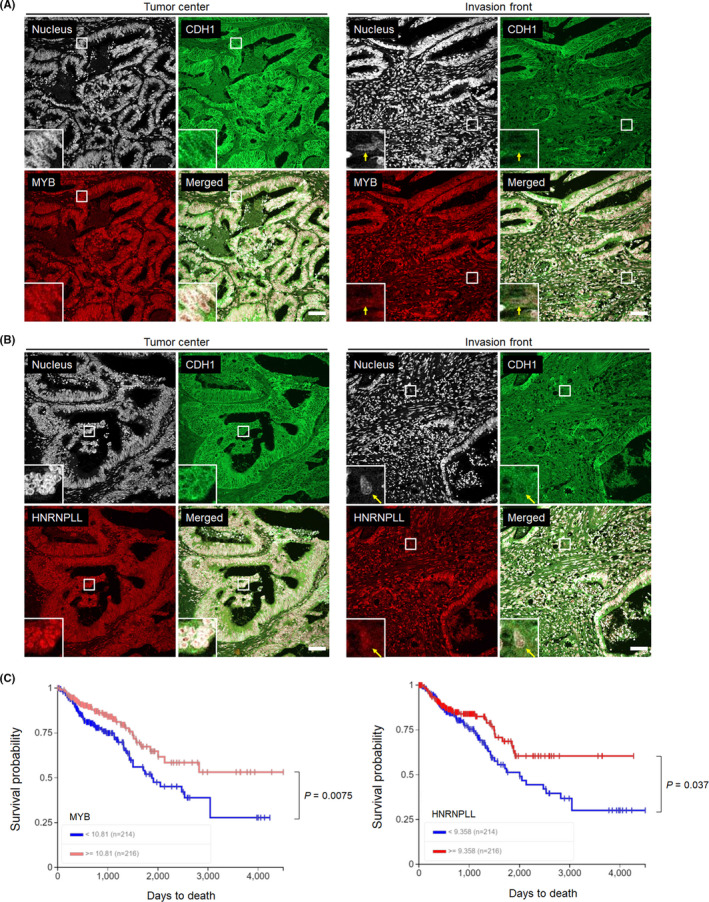
FIGURE 4.

Assessment of the clinical relevance of MYB and HNRNPLL to CRC progression. A, Immunohistochemical analysis for MYB (green) and E‐cadherin (CDH1, red) in paraffin‐embedded sections obtained from surgically resected primary colon cancer tissues. Bars, 20 μm. A magnified view of the squared area is shown in the left‐bottom corner of each panel. Arrows indicate cancer cells showing EMT‐phenotypes, namely, low cell‐surface CDH1 expression and isolation from glandular structures. B, Sections from the same patient were stained for HNRNPLL (green) and CDH1 (red). Bars, 20 μm. C, Kaplan‐Meier analysis of the survival probability (days to death) of CRC patients according to high or low expression levels of MYB (left) or HNRNPLL (right) in the TCGA database. Statistical analysis was performed using the log‐rank chi‐square test
