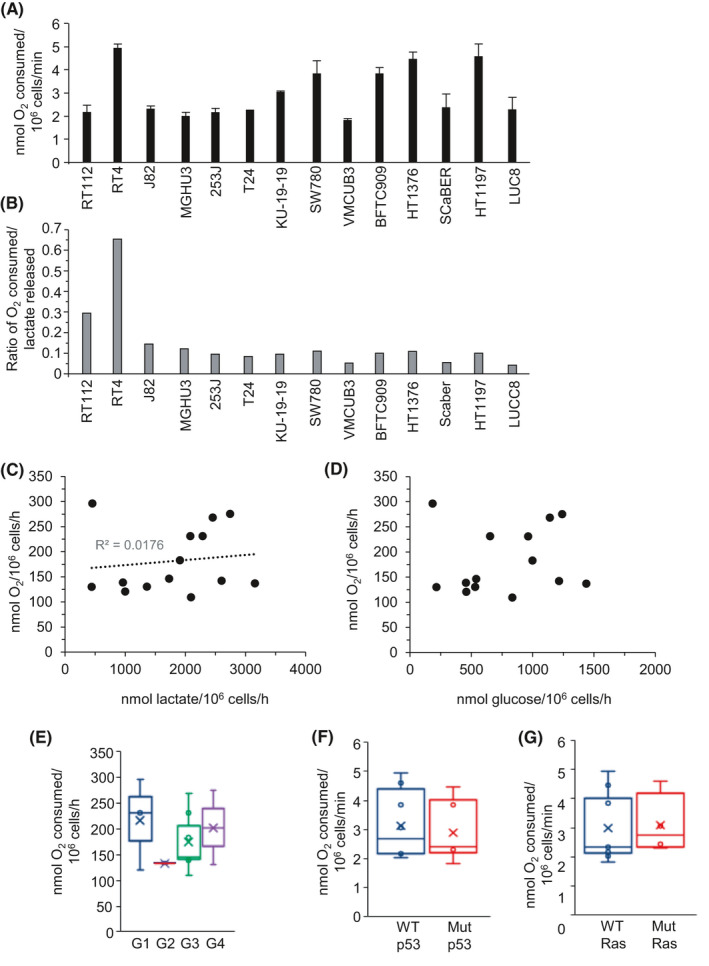
FIGURE 2.

Oxygen consumption rates of bladder cancer cell lines are independent of aerobic glycolysis and cellular rates of lactate production. A, Rate of cellular oxygen consumption of the indicated human bladder cancer cell lines (nmoles of oxygen consumed per 106 cells per minute). Values presented represent the mean ± SD from three independent experiments. Cell lines are ordered from left to right on the basis of cellular lactate release (low to high rate of lactate release). B, Ratio of the rate of cellular oxygen consumption to the rate of cellular lactate release for the indicated human bladder cancer cell lines. The ratios are calculated from the mean rates shown in Figure 2A (O2 consumed) and Figure 1A (lactate released). Scatter plots of cellular oxygen consumption rate against the rate of cellular lactate release (C), or glucose consumption rate (D) with the mean rates for each individual cell line indicated by a black circle. Box and whisker plots showing the median, mean (x), and minimum and maximum rates of cell line oxygen consumption following cell line clustering by grade (E), p53 status (F), or Ras status (G)
