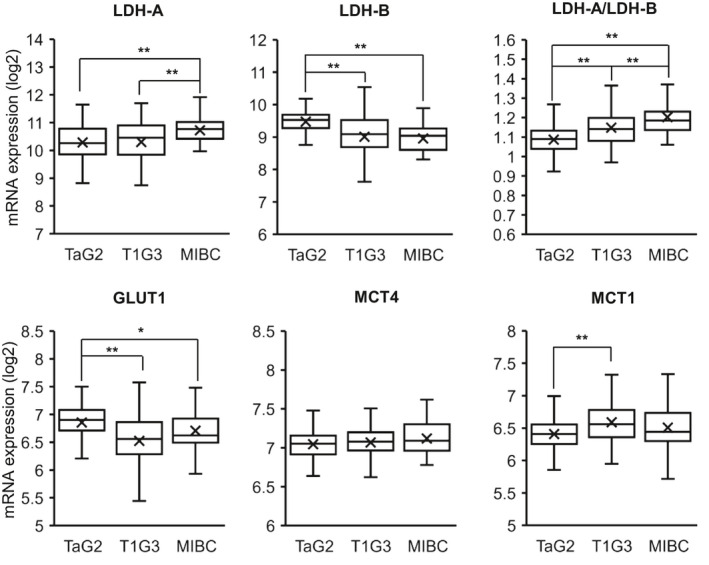
FIGURE 7.

mRNA expression of putative targets associated with the Warburg effect in Ta, T1, and muscle‐invasive bladder cancer (MIBC) clinical specimens. mRNA expression analysis (log2) of the indicated targets associated with the Warburg effect (LDH‐A, GLUT1, MCT4) and intratumoral metabolic coupling (lactate import transporter MCT1) in 263 urothelial tumor specimens (125 Ta G2, 106 T1 G3, and 32 MIBC clinical specimens). LDH‐A/LDH‐B indicates ratio of LDH‐A expression relative to LDH‐B. Box and whisker plots showing the median, mean (x), and minimum and maximum expression following clustering by stage. *P < .05, **P < .01; Student's t‐test
