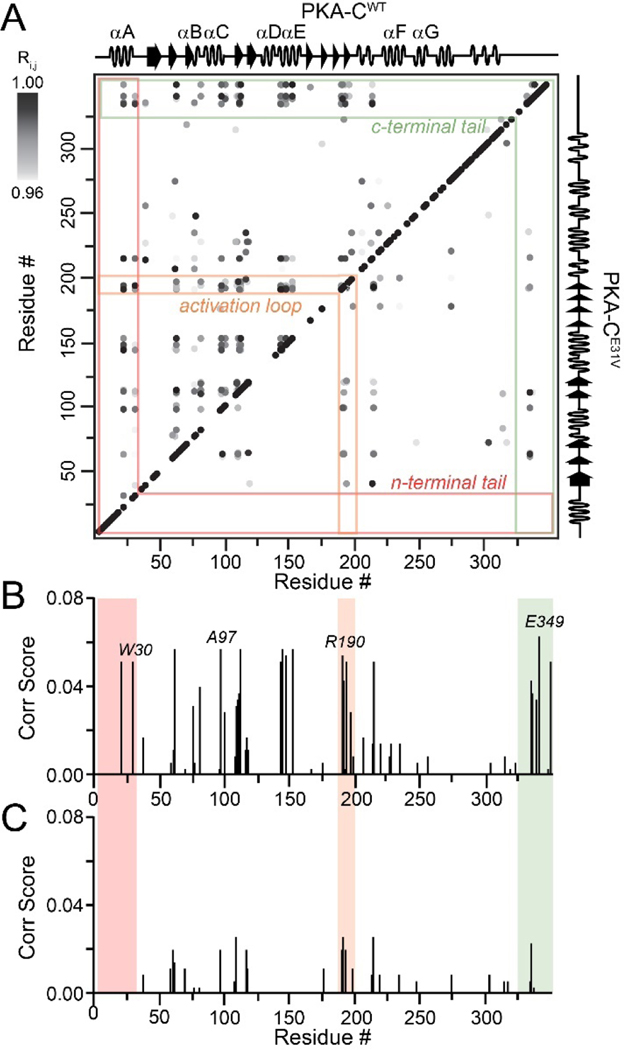
Figure 3. Intramolecular allosteric network as mapped by correlated chemical shift changes.
(A) CHESCA correlation matrix of PKA-CWT (top diagonal) and PKA-CE31V (bottom diagonal) upon binding PKI highlighting the notable reductions in correlations within the n-terminal tail (red), activation loop (orange), and c-terminal tail (green). Only correlations with Rij> 0.98 are shown. Plot of correlation score vs. residue for (B) PKA-CWT and (C) PKA-CE31V emphasizing the residues that show the largest reductions in correlation score that make contacts with the αC-helix. See material and methods for the calculation of correlation scores.

