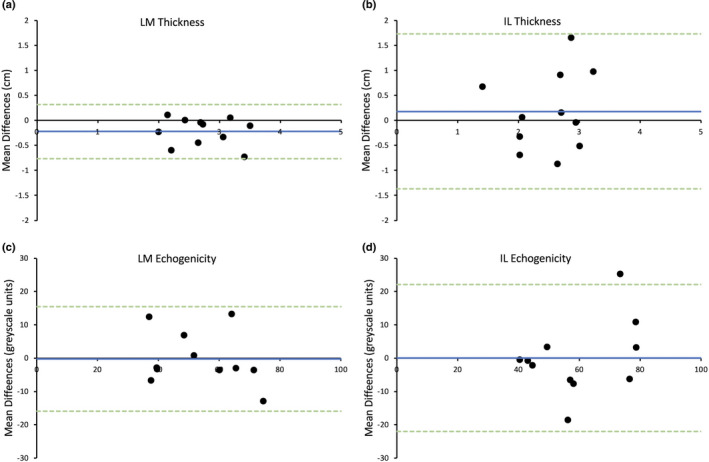
FIGURE 3.

Bland–Altman plot displaying difference of agreement between average measurements taken 1 week apart for Assessor B for the thickness of lumbar multifidus (LM) (a) and iliocostalis lumborum (IL) (b) and the echogenicity of LM (c) and IL (d). Blue line = mean differences, green dotted lines = upper and lower limits of agreement (2 standard deviations)
