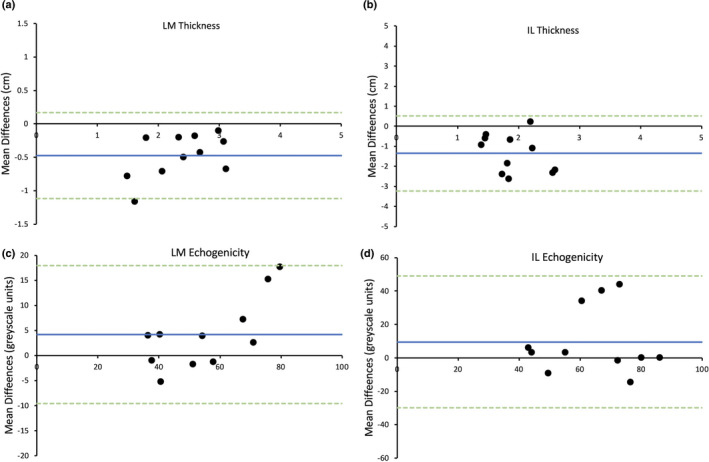
FIGURE 4.

Bland–Altman plot displaying difference of agreement between average measurements by the two raters for the thickness of lumbar multifidus (LM) (a) and iliocostalis lumborum (IL) (b) and the echogenicity of LM (c) and IL (d). Blue line = mean differences, green dotted lines = upper and lower limits of agreement (2 standard deviations)
