. 2021 Jul 19;12(34):11364–11381. doi: 10.1039/d1sc01185e

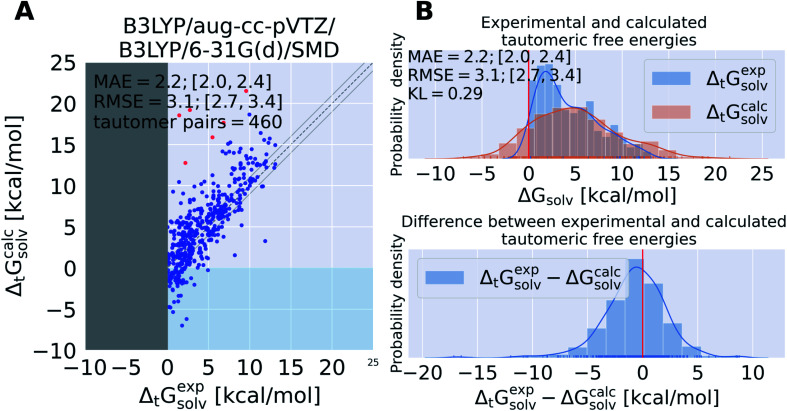
Fig. 4. State of the art quantum chemistry calculations are able to calculate tautomeric free energy differences ΔtGcalcsolv with a RMSE of 3.1 kcal mol−1. The direction of the tautomer reaction is chosen so that the experimentally obtained tautomeric free energy difference ΔtGexpsolv is always positive. Panel (A) shows ΔtGcalcsolv as the difference between the sum of the gas phase free energy and transfer free energy for each tautomer pair plotted against the experimental tautomeric free energy difference in solution ΔtGexpsolv. B3LYP/aug-cc-pVTZ is used for the gas phase geometry optimization and single point energy calculation, the ideal gas RRHO approximation is used to calculate the thermal corrections. The transfer free energy is calculated on B3LYP/aug-cc-pVTZ/SMD optimized geometries using B3LYP/6-31G(d) and SMD. Values in quadrant II (x-axis entries positive, y-axis entries negative) indicate calculations that assigned the wrong dominant tautomer species (different sign of ΔtGcalcsolv and ΔtGexpsolv). The dashed line indicates the ideal behavior of the calculated and experimental values, the grey lines mark the ±1 kcal mol−1 interval. Red dots indicate tautomer pairs with more than 10 kcal mol−1 absolute error between ΔtGcalcsolv and ΔtGexpsolv. These tautomer pairs are separately shown in Table S.I.1. In panel (B), the top panel shows the kernel density estimate (KDE) and histogram of ΔtGcalcsolv and ΔtGexpsolv. The red line indicates zero free energy difference (equipopulated free energies). In the lower panel the KDE of the difference between ΔtGexpsolv and ΔtGcalcsolv is shown. MAE and RMSE are reported in units of kcal mol−1. Quantities in brackets [X;Y] denote 95% confidence intervals. The Kullback–Leibler divergence (KL) was calculated using KL(ΔtGexpsolv‖ΔtGcalcsolv).

Fig. 4