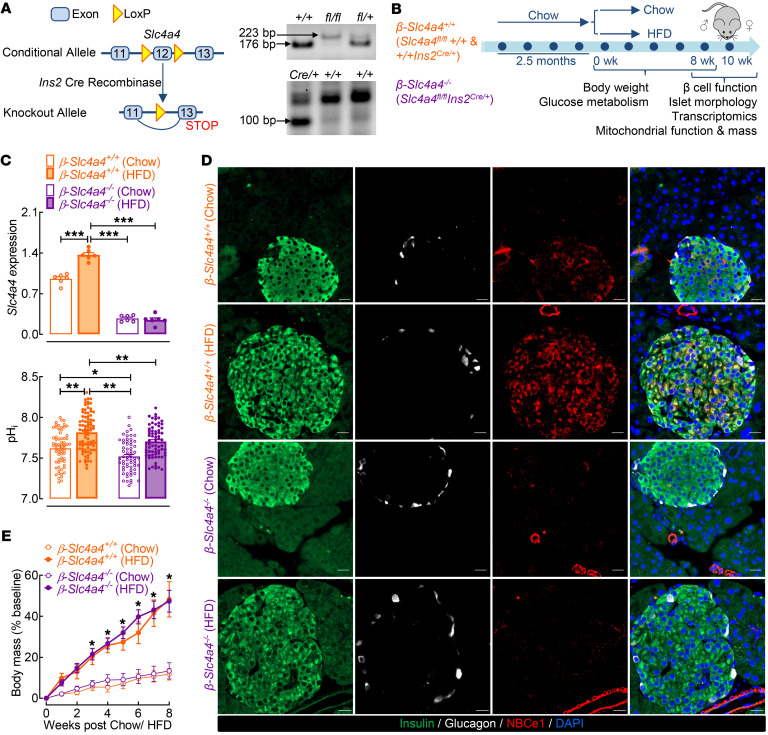
Figure 4. Generation and validation of a β cell–selective Slc4a4-null mouse model.
(A) Targeting strategy for β cell–selective deletion of Slc4a4 (left). Representative PCR analyses of tail DNA using primers for identification of Slc4a4 floxed allele and Cre recombinase (right). (B) Diagram of study design indicating that 2-month-old control (β-Slc4a4+/+ Slc4a4fl/fl+/+ and +/+Ins2Cre/+) and β cell Slc4a4-KO (β-Slc4a4–/– Slc4a4fl/flIns2Cre/+) mice were treated for 8 weeks with either chow diet or 60% HFD. In vivo characterization of glucose metabolism occurred at 0, 4, and 8 weeks. Islets were isolated from the mice for functional and transcriptomic profiling; pancreata were isolated for morphological assessment. (C) Slc4a4 expression from β-Slc4a4+/+ (Slc4a4fl/fl+/+) and β-Slc4a4–/– (Slc4a4fl/flIns2Cre/+) pancreatic islets exposed to either 8 weeks of chow or HFD. ***P < 0.001 denotes statistical significance versus β-Slc4a4+/+ chow (unpaired, 2-tailed t test; n = 6 mice per genotype and diet) (top). pHi measured in β-Slc4a4+/+ (Slc4a4fl/fl+/+) and β-Slc4a4–/– (Slc4a4fl/flIns2Cre/+) islet cells exposed to either 8 weeks of chow or HFD. *P < 0.05, **P < 0.01 denotes statistical significance (1-way ANOVA with Tukey’s method for multiple comparisons; n = 62–87 independent cells from n = 2 mice per genotype and diet) (bottom). (D) Representative examples of pancreatic sections and individual islets immunostained for insulin (green), glucagon (white), NBCe1 (red), and DAPI (blue) imaged at 20× original magnification obtained from β-Slc4a4+/+ (Slc4a4fl/fl+/+) and β-Slc4a4–/– (Slc4a4fl/flIns2Cre/+) mice exposed to 8 weeks of chow or HFD. Scale bars: 20 μm. Images are representative of n = 3 mice per genotype and diet. (E) Percentage change in body mass from baseline of β-Slc4a4+/+ (Slc4a4fl/fl+/+) and β-Slc4a4–/– (Slc4a4fl/flIns2Cre/+) mice exposed to either 8 weeks of chow or HFD. *P < 0.05 denotes statistical significance versus β-Slc4a4+/+ chow (2-way ANOVA with Dunnett’s method for multiple comparisons; n = 5–7 mice per genotype and diet). All values are represented as mean ± SEM.

