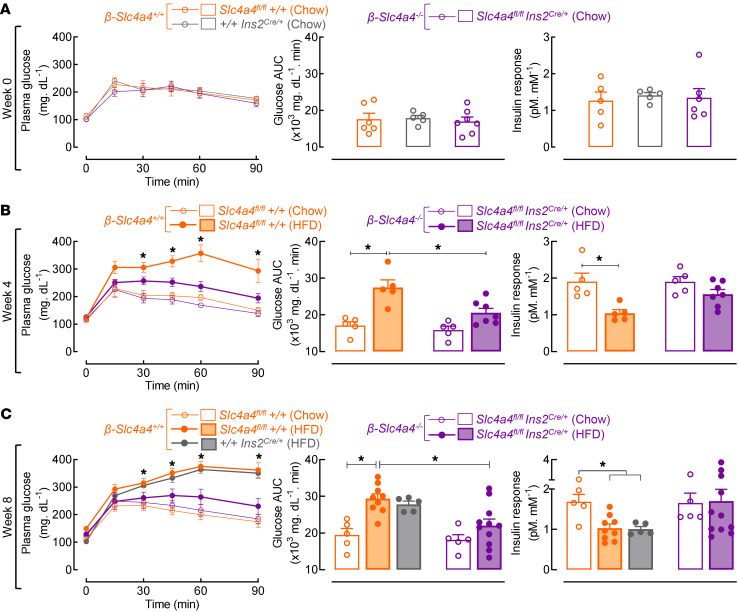
Figure 5. Selective deletion of Slc4a4 in β cells protects against high-fat diet–induced glucose intolerance and β cell dysfunction in mice in vivo.
(A) Glucose tolerance (left), glucose tolerance AUC (center), and corresponding insulin response expressed as the plasma insulin AUC normalized to basal insulin secretion in pM divided by the glucose tolerance AUC in mM (right) of 2-month-old control β-Slc4a4+/+ (+/+Ins2Cre/+and/or Slc4a4fl/fl+/+) and β-Slc4a4–/– mice (Slc4a4fl/flIns2Cre/+) (n = 5–7 mice per group). (B and C) Glucose tolerance (left), glucose tolerance AUC (center), and corresponding insulin response (right) of control β-Slc4a4+/+ (+/+Ins2Cre/+ and/or Slc4a4fl/fl+/+) and β-Slc4a4–/–(Slc4a4fl/flIns2Cre/+) mice exposed to either 4 weeks (B) or 8 weeks (C) of chow diet or HFD (n = 5–11 mice per group). For glucose tolerance, *P < 0.05 denotes statistical significance versus β-Slc4a4+/+ chow (2-way ANOVA with Dunnett’s method for multiple comparisons). For glucose tolerance AUC and insulin response, *P < 0.05 denotes statistical significance (1-way ANOVA with Dunnett’s method for multiple comparisons) as indicated in the text. All values are represented as mean ± SEM.

