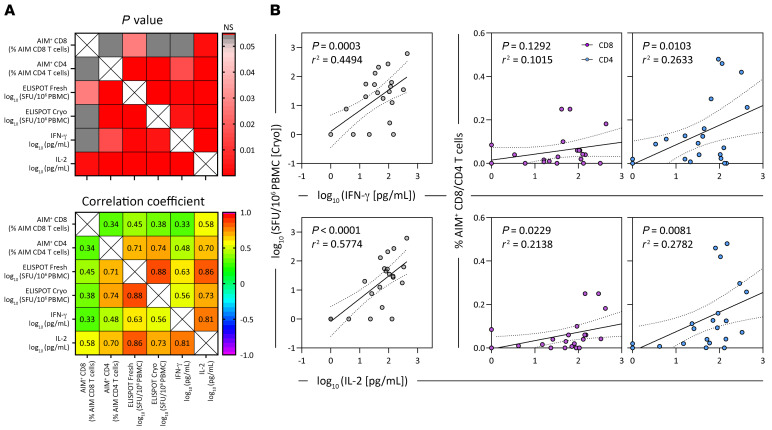
Figure 2. Correlation matrix of different assays used to quantify spike-specific T cells.
(A) The top matrix shows the significance of the correlation, and the Spearman’s correlation coefficient is shown in the matrix below (n = 6; 24 samples). (B) Linear regression analysis of the concentrations of IFN-γ and IL-2 in SpG peptide pool–stimulated whole blood and the corresponding frequency of SpG-reactive T cells in cryopreserved PBMCs quantified by either IFN-γ ELISPOT or AIM assay (n = 6; 24 samples). Dotted lines denote the 95% CI.

