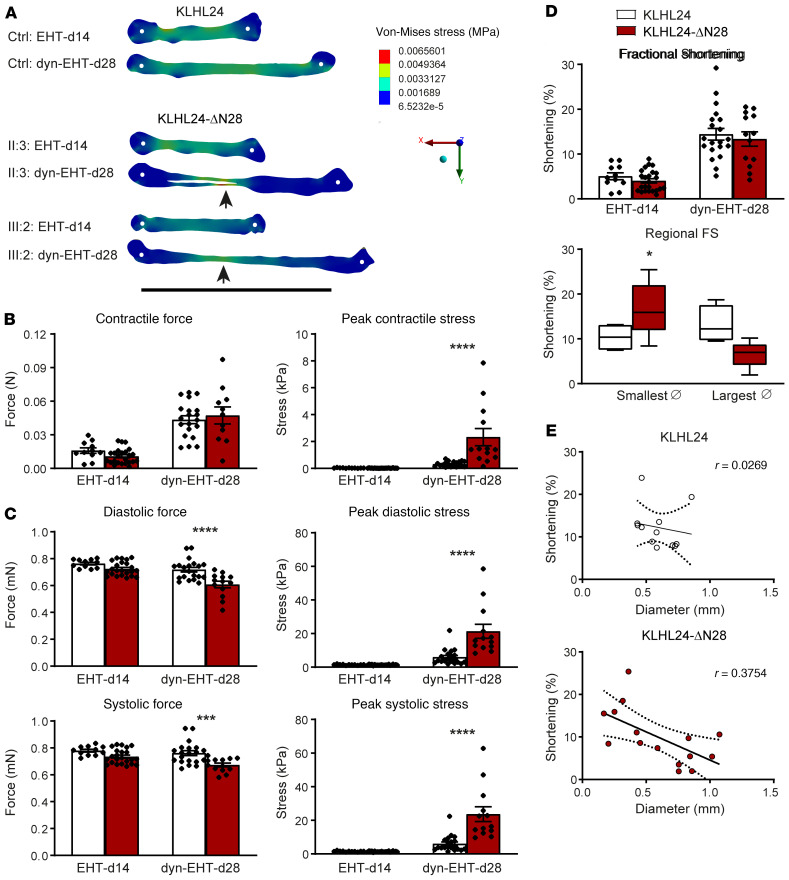
Figure 3. Functional analysis of patient-derived EHTs/dyn-EHTs.
(A) Representative maps of regional diastolic stress using FEM in patient- and control-derived tissues at the onset and after 14 days of dynamic loading. Arrows point toward the thinnest sections with the highest stress. White dots represent the tissue attachment point with the PDMS strip. Scale bar: 10 mm. (B) Contractile force and corresponding peak contractile stress of control- and patient-derived tissues imaged at day 14 (EHTs) and day 28 (dyn-EHTs). n = 11 (d14) and n = 20 (d28) for control-derived tissues, n = 13 (d28) and n = 23 (d14) for patient-derived tissues. ****P < 0.0001 (2-way ANOVA, post hoc Sidak’s multiple comparison test compared with control-derived dyn-EHTs at day 28). (C) Diastolic and systolic force and corresponding peak diastolic and systolic stress. ***P < 0.001 (compared with control-derived dyn-EHTs at day 28); ****P < 0.0001 (compared with control-derived dyn-EHTs at day 28). (D) The average and regional FS of dyn-EHTs measured as percentages, where speckle tracking analysis is used to determine the latter. *P < 0.05 (2-way ANOVA, post hoc Sidak’s multiple comparison test comparing smallest diameters of dyn-EHTs at day 28). (E) Correlation analysis shows a negative correlation between FS and tissue diameter in patient-derived dyn-EHTs only.

