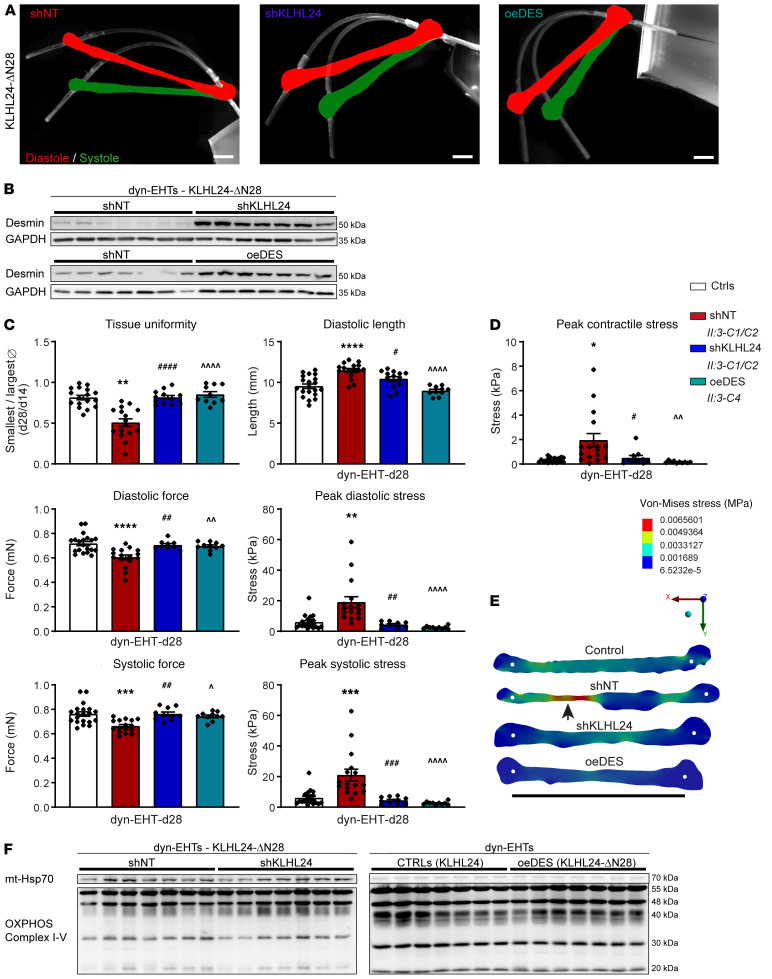
Figure 5. Analysis of patient-derived dyn-EHTs with RNAi of KLHL24 or desmin overexpression.
(A) Representative side view pictures of patient-derived shNT, shKLHL24, and oeDES dyn-EHTs at day 28. Strips are in white and the images are overlays of shots at tissue diastole (red) and systole (green). Scale bars: 1.5 mm. (B) Desmin protein levels in shKLHL24 versus shNT and patient versus oeDES-derived patient dyn-EHTs, measured on blot (quantified graphs in the supplement). (C) Morphological and functional parameters of patient, shNT, shKLHL24, and oeDES compared with control-derived dyn-EHTs (n = ±15), shKLHL24 (n = 15), and oeDES (n = 10) patient tissues at day 28 (dyn-EHTs), relative to control (n = 20). #P < 0.05 (1-way ANOVA, post hoc Sidak’s multiple comparison test of patient shKLHL24 versus shNT dyn-EHTs); ##P < 0.01 (patient shKLHL24 versus shNT); ###P < 0.001 (patient shKLHL24 versus shNT); ####P < 0.0001 (patient shKLHL24 versus shNT); ^P < 0.05 (patient oeDES versus shNT); ^^P < 0.01 (patient oeDES versus shNT); ^^^^P < 0.0001 (patient oeDES versus shNT); **P < 0.01 (patient shKLHL24 versus control); ****P < 0.0001 (patient shKLHL24 versus control). (D) Peak contractile stress values of above dyn-EHTs. *P < 0.05 (1-way ANOVA, post hoc Sidak’s multiple comparison test of patient shKLHL24 versus control); #P < 0.05 (patient shKLHL24 versus shNT); ^^P < 0.01(patient oeDES versus shNT). (E) Representative maps of regional diastolic stress values derived from FEM in patient, shNT, shKLHL24, and oeDES compared with control-derived dyn-EHTs. White dots represent the tissue attachment point with the PDMS strip. Scale bar: 10 mm. (F) Western blots containing OXPHOS complex proteins (I–V) from patient-derived shNT compared with shKLHL24 dyn-EHTs and patient-derived oeDES compared with control-derived dyn-EHTs. mtHSP70 poses here as a specific loading control. Quantifications are in the supplement.

