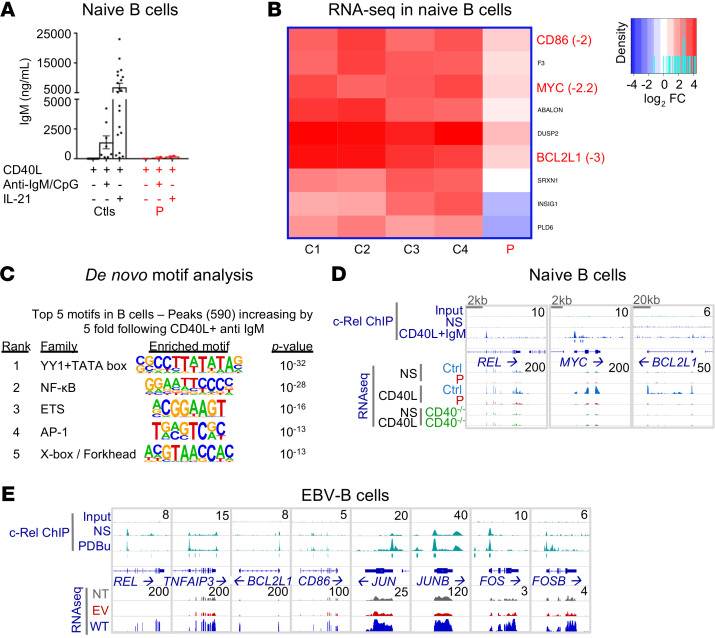
Figure 9. The B cell response is impaired in c-Rel deficiency.
(A) Naive B cells from controls (n = 20) and P, cultured with CD40L, alone or in combination with anti-IgM mAb and CpG or IL-21 for 7 days. IgM secretion was assessed by IgH chain–specific ELISA. n = 2. Data indicate the mean ± SEM. (B) Heatmap representing the log2 FC of expression in naive B cells stimulated with CD40L at 2 hours. Only the genes both differentially expressed in response to stimulation in controls (adjusted P < 0.05 and | log2 FC | >1) and differentially expressed in P (adjusted P < 0.05 and | log2 FC | >2) are shown. For selected genes, the log2 FC difference between controls and P is indicated. (C) DNA binding motifs enriched at CD40L plus anti-IgM–induced c-Rel binding peaks. The de novo motif discovery P value and family of transcription factors are shown. (D) Genomic snapshots of selected genes with altered responses to CD40L in P. Shown, from top to bottom, are the normalized sequence read profiles for control input DNA and ChIP-Seq for c-Rel in nonstimulated and CD40L plus anti-IgM–treated naive B cells from controls (blue boxes indicate significant c-Rel binding peaks), together with RNA-Seq profiles for nonstimulated and CD40L-treated controls (overlaid), P, and a CD40-deficient patient. (E) Genomic snapshots of selected genes for which expression in P’s EBV-B cells was rescued by retroviral transduction with a plasmid encoding the WT c-Rel. Shown, from top to bottom, are normalized profiles for control input DNA and ChIP-Seq for c-Rel in nonstimulated and PDBu-treated EBV-B cells from controls (blue boxes indicate significant c-Rel binding peaks), together with RNA-Seq profiles for nonstimulated EBV-B cells from P that were not transfected, or that were transfected with an empty retroviral plasmid or a plasmid encoding the WT c-Rel.

