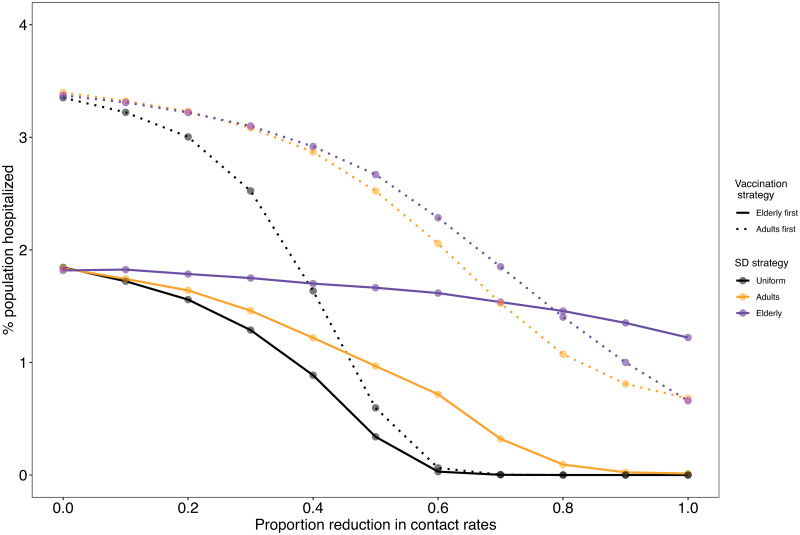
Fig 3. Effects of joint interventions on the proportion of the population hospitalized (PH).
Each data point represents a combination of a vaccination strategy (solid vs. dotted lines) and a social distancing strategy (colors) at particular social distancing strength (x-axis). Simulations were run using a daily deployment of κ = 0.5% of the population.

