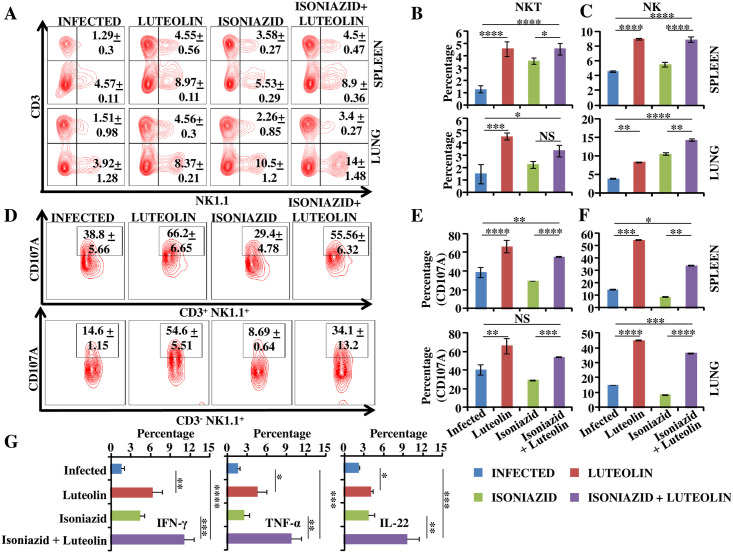
Fig 4. Luteolin-mediated anti-TB responses involve natural killer and natural killer T cells.
Alveolar cells and splenocytes isolated from the indicated mice at 60 days post-infection were surface-stained with anti-CD3 and -NK1.1 antibodies. Representative FACS profile (A) and proportion of natural killer T (NKT) cells (B) and natural killer (NK) cells (C) in vivo in spleen (B&C, upper panel) and lung (B&C, lower panel) of different experimental groups. (D) Representative flow plots depicting antigen-specific degranulation potential of NKT (upper panel) and NK cells (lower panel) ex vivo. Fraction of degranulating NKT cells (E) and NK cells (F) in spleen (upper panel) and lung (lower panel). (G) Intracellular cytokine profiling of NKT cells in lungs. Data shown are representative of three independent experiments with three mice in each group and represent the MEAN±STDEV values. Differences were considered significant at P<0.05 and are represented by * p<0.05, ** p<0.01, *** p<0.001, **** p<0.0001 whereas non-significant differences are denoted by (NS).

