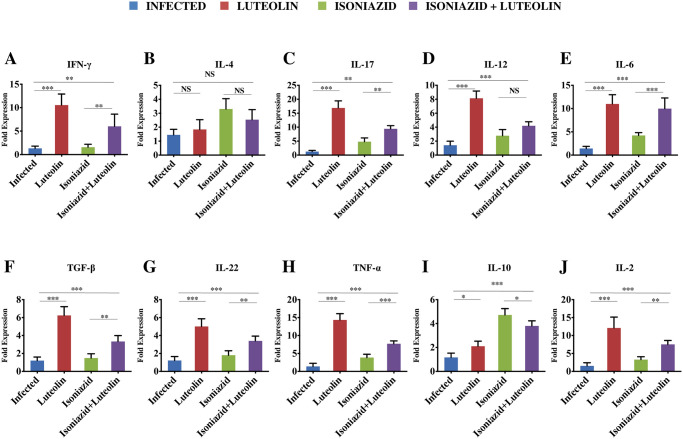
Fig 5. Expression of pro- and anti-inflammatory cytokines in the lungs of infected animals.
The lungs from infected and treated mice were macerated and ex-vivo stimulated with M.tb complete soluble antigen for 24 h followed by RNA extraction and RT-PCR analysis (see Materials and methods). Bar graphs represent the fold change in the expression of (A) IFN-γ, (B) IL-4, (C) IL-17, (D) IL-12, (E) IL-6, (F) TGF-β, (G) IL-22, (H) TNF-α, (I) IL-10 and (J) IL-2 in various groups of mice as compared to the control infected mice. Data represents 5 mice per group (Mean ± SD, n = 5). *p<0.05, **p< 0.005, ***p<0.0005.

