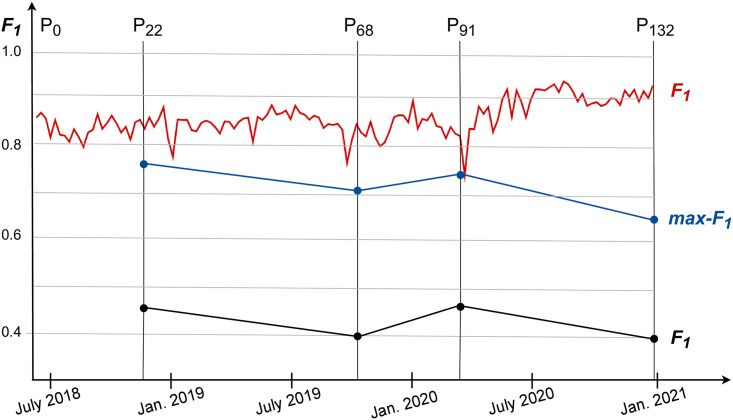
Fig 2. Differences between the adjacent network partitions measured by the F1 score.
The red line at the top shows weekly differences F1(Pt|Pt−1) at timepoints t = 1, 2, …, 132. The five selected partitions are denoted by P0, P22, …, P132. The middle blue line shows the theoretical maximum max-F1 differences between distant partitions at the selected timepoints t = 0, 22, 68, 91, 132. The bottom black line shows the standard F1 differences.

