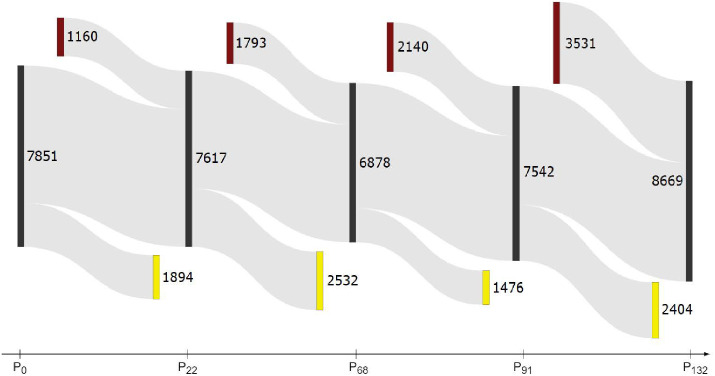
Fig 3. A Sankey diagram showing major transitions between the five selected timepoints P0, P22, …, P132.
The numbers indicate core nodes (black), new nodes (brown, at top), and lost nodes (yellow, at bottom) between two adjacent network partitions. The differences between the adjacent partitions are quantified by max-F1(Pi|Pi−1), shown with blue line in Fig 2. Note a relatively large in- and out-flow of new and lost nodes between the partitions.

