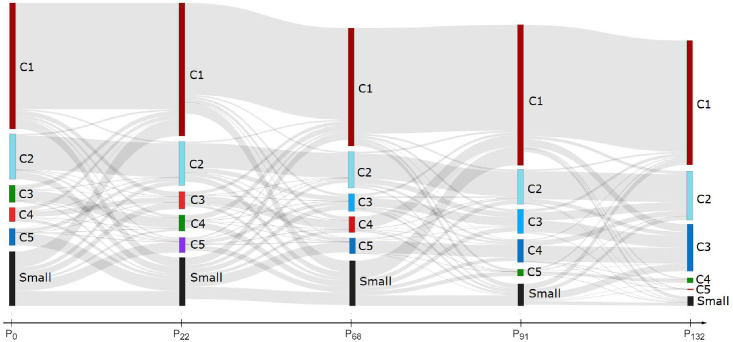
Fig 4. A Sankey diagram showing transitions between the five largest communities C1, …, C5 at the selected timepoints P0, P22, …, P132.
The remaining smaller communities are labeled as Small, and new and lost nodes are not shown here. The differences between the adjacent partitions are quantified by F1(Pi|Pi−1), shown with black line in Fig 2. The left-leaning communities are in shades of red, the right-leaning communities are in shades of blue, and the Sports community is green.

