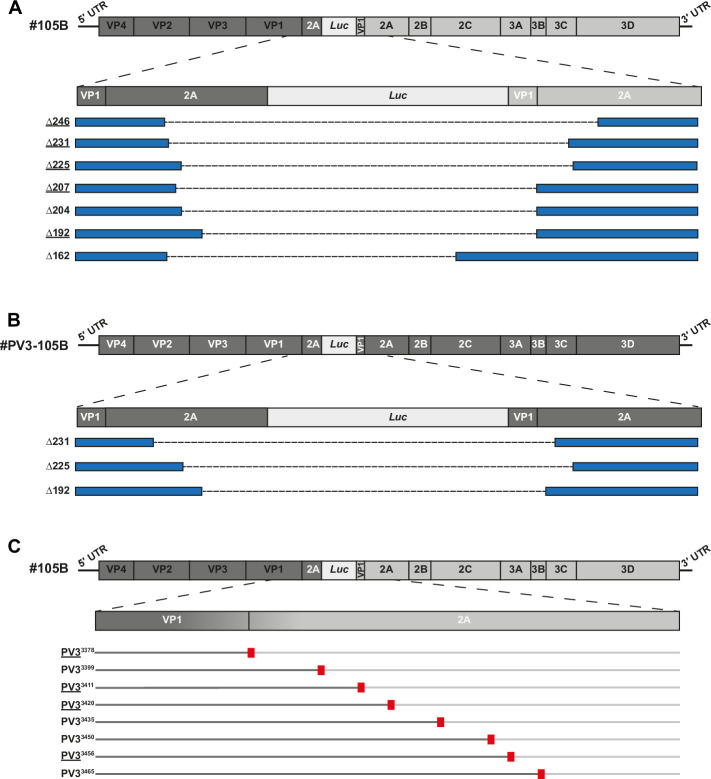
Fig 3. Nanopore analysis of #105B and #PV3-105B recombinant populations.
The sequences of viable recombinant genomes were determined by consensus generation from Oxford Nanopore reads from all #105B and #PV3-105B passaging populations sequenced. Partially resolved genomes are shown for (A) #105B and (B) #PV3-105B. The original genome is shown at the top, where regions in dark grey are derived from PV3 and regions in light grey are derived from PV1, and an expanded view of the duplicated region shown below. Individual recombinants are denoted blue boxes with dashed lines representing the region of the duplication that has been lost. Numbers on the left-hand side represent the number of nt deleted from the 249 nt required to fully resolve the genome. Underlined recombinant names indicates recombinants detected in both replicate samples. (C) Resolved variants of #105B. Top schematic represents the genome of #105B with an expanded view of the VP1/2A region expected for a resolved recombinant. Resolved variants are represented by dual-coloured lines with sequence from PV3 in dark grey and sequence from PV1 in light grey. Red boxes denote the location of the resolved junction. Recombinant names, denoting the junction position, are given on the left. Underlined recombinant names indicates recombinants detected in both replicate samples.

