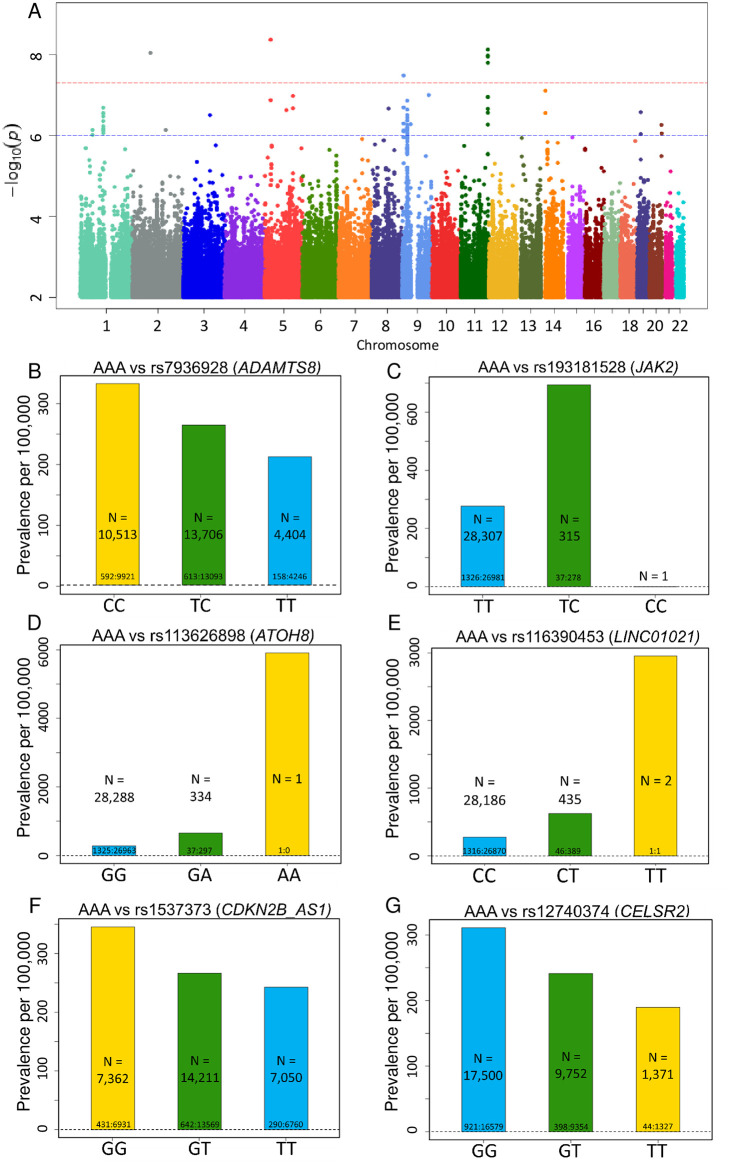
Fig 1. Top SNPs associated with AAA.
(A) Manhattan plot of GWAS results (MAF >0.5%) for AAA. Significance is displayed on the y-axis as -log10 of the p-value, with results ordered along the x-axis by chromosome (each bar represents a different chromosome). (B-G) Prevalence of abdominal aortic aneurism (AAA) per 100,000 participants in the UK Biobank by genotype. Bars labeled with ratio of cases: Controls. (B) Prevalence of AAA decreases with ADAMTS8 variant rs7936928 status (P-value = 7.51x10⁻⁹, OR per T allele = 0.786). Decrease in AAA prevalence is noted in the homozygotes for the minor allele (T/T) in comparison to the heterozygotes (C/T) and the noncarriers (C/C) in a stepwise, “dosage-dependent” manner. (C) Prevalence of AAA increases with JAK2 variant rs193181528 status (P-value = 3.26x10⁻⁸, OR per C allele = 2.776). (D) Prevalence of AAA increases with ATOH8 variant rs113626898 status (P-value = 9.06x10⁻⁹, OR per A allele = 2.714). (E) Prevalence of AAA increases with LINC01021 variant rs116390453 status (P-value = 4.26 x10⁻⁹, OR per T allele = 2.505). (F) Prevalence of AAA decreases with CDKN2B-AS1 variant rs1537373 status (P-value = 6.68x10⁻⁷, OR per T allele = 0.8211). (G) Prevalence of AAA decreases with CELSR2 variant rs12740374 status (P-value = 2.04x10⁻⁷, OR per T allele = 0.7668).

